RESEARCH PROJECT · HYPERGRAPH GENERATION
Hypergraph Generation
with Latent Diffusion
Modeling nodes and hyperedges as two coupled generative views.
RESEARCH PROJECT · HYPERGRAPH GENERATION
Modeling nodes and hyperedges as two coupled generative views.
Real-world interactions often involve groups of entities at once. Janus learns a distribution of hypergraphs by combining a dual-view variational autoencoder with cross-conditioned latent diffusion, preserving the relationship between nodes and hyperedges.
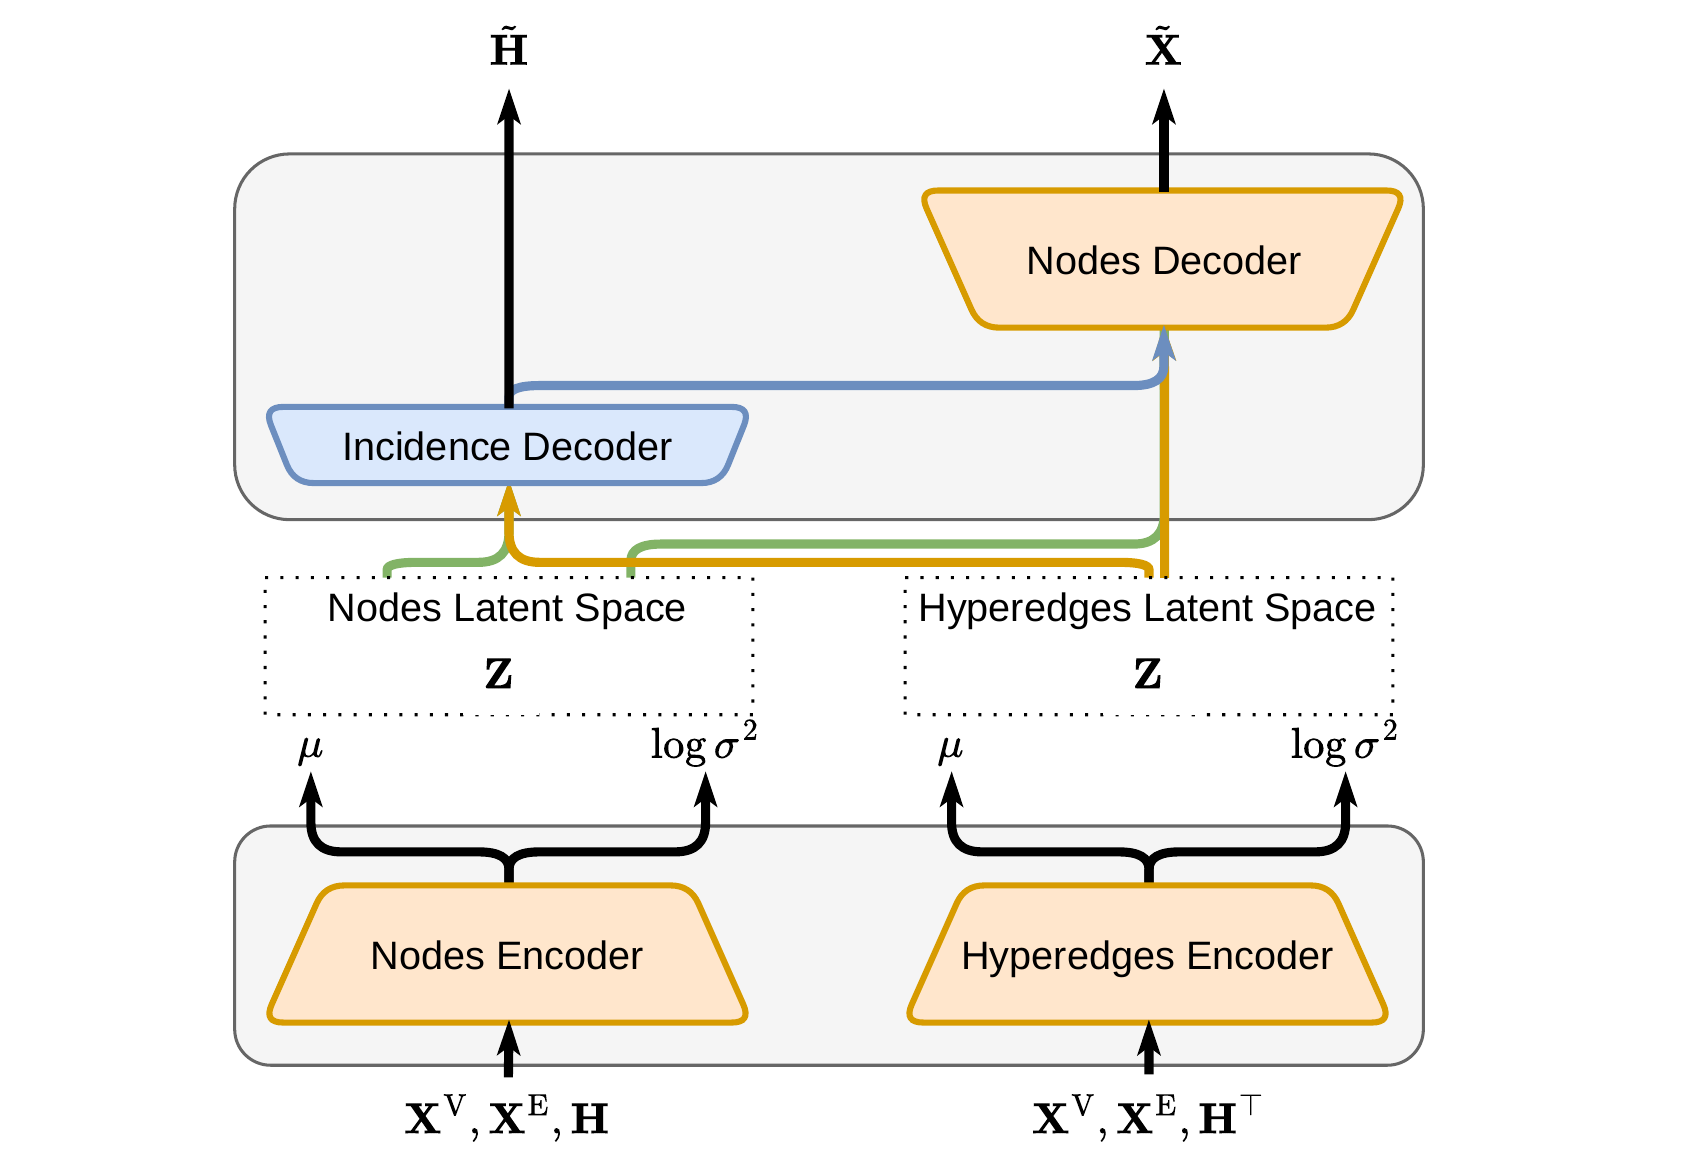
Learn separate but interdependent node and hyperedge latent spaces with a β-VAE.
Generate two latent views with cross-attention, then decode a coherent incidence structure.
Sample local sub-hypergraphs and merge them into realistic larger structures.
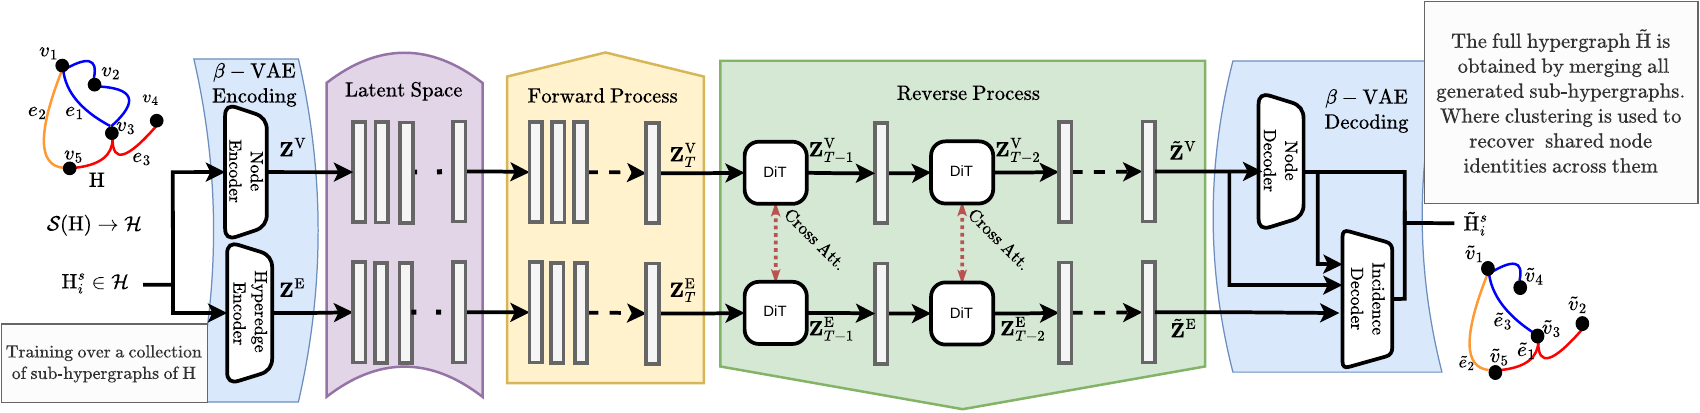
Extract overlapping sub-hypergraphs to learn from a single high-order network without modeling the combinatorial hyperedge space directly.
The β-VAE encodes node and hyperedge representations and learns to recover their incidence relations.
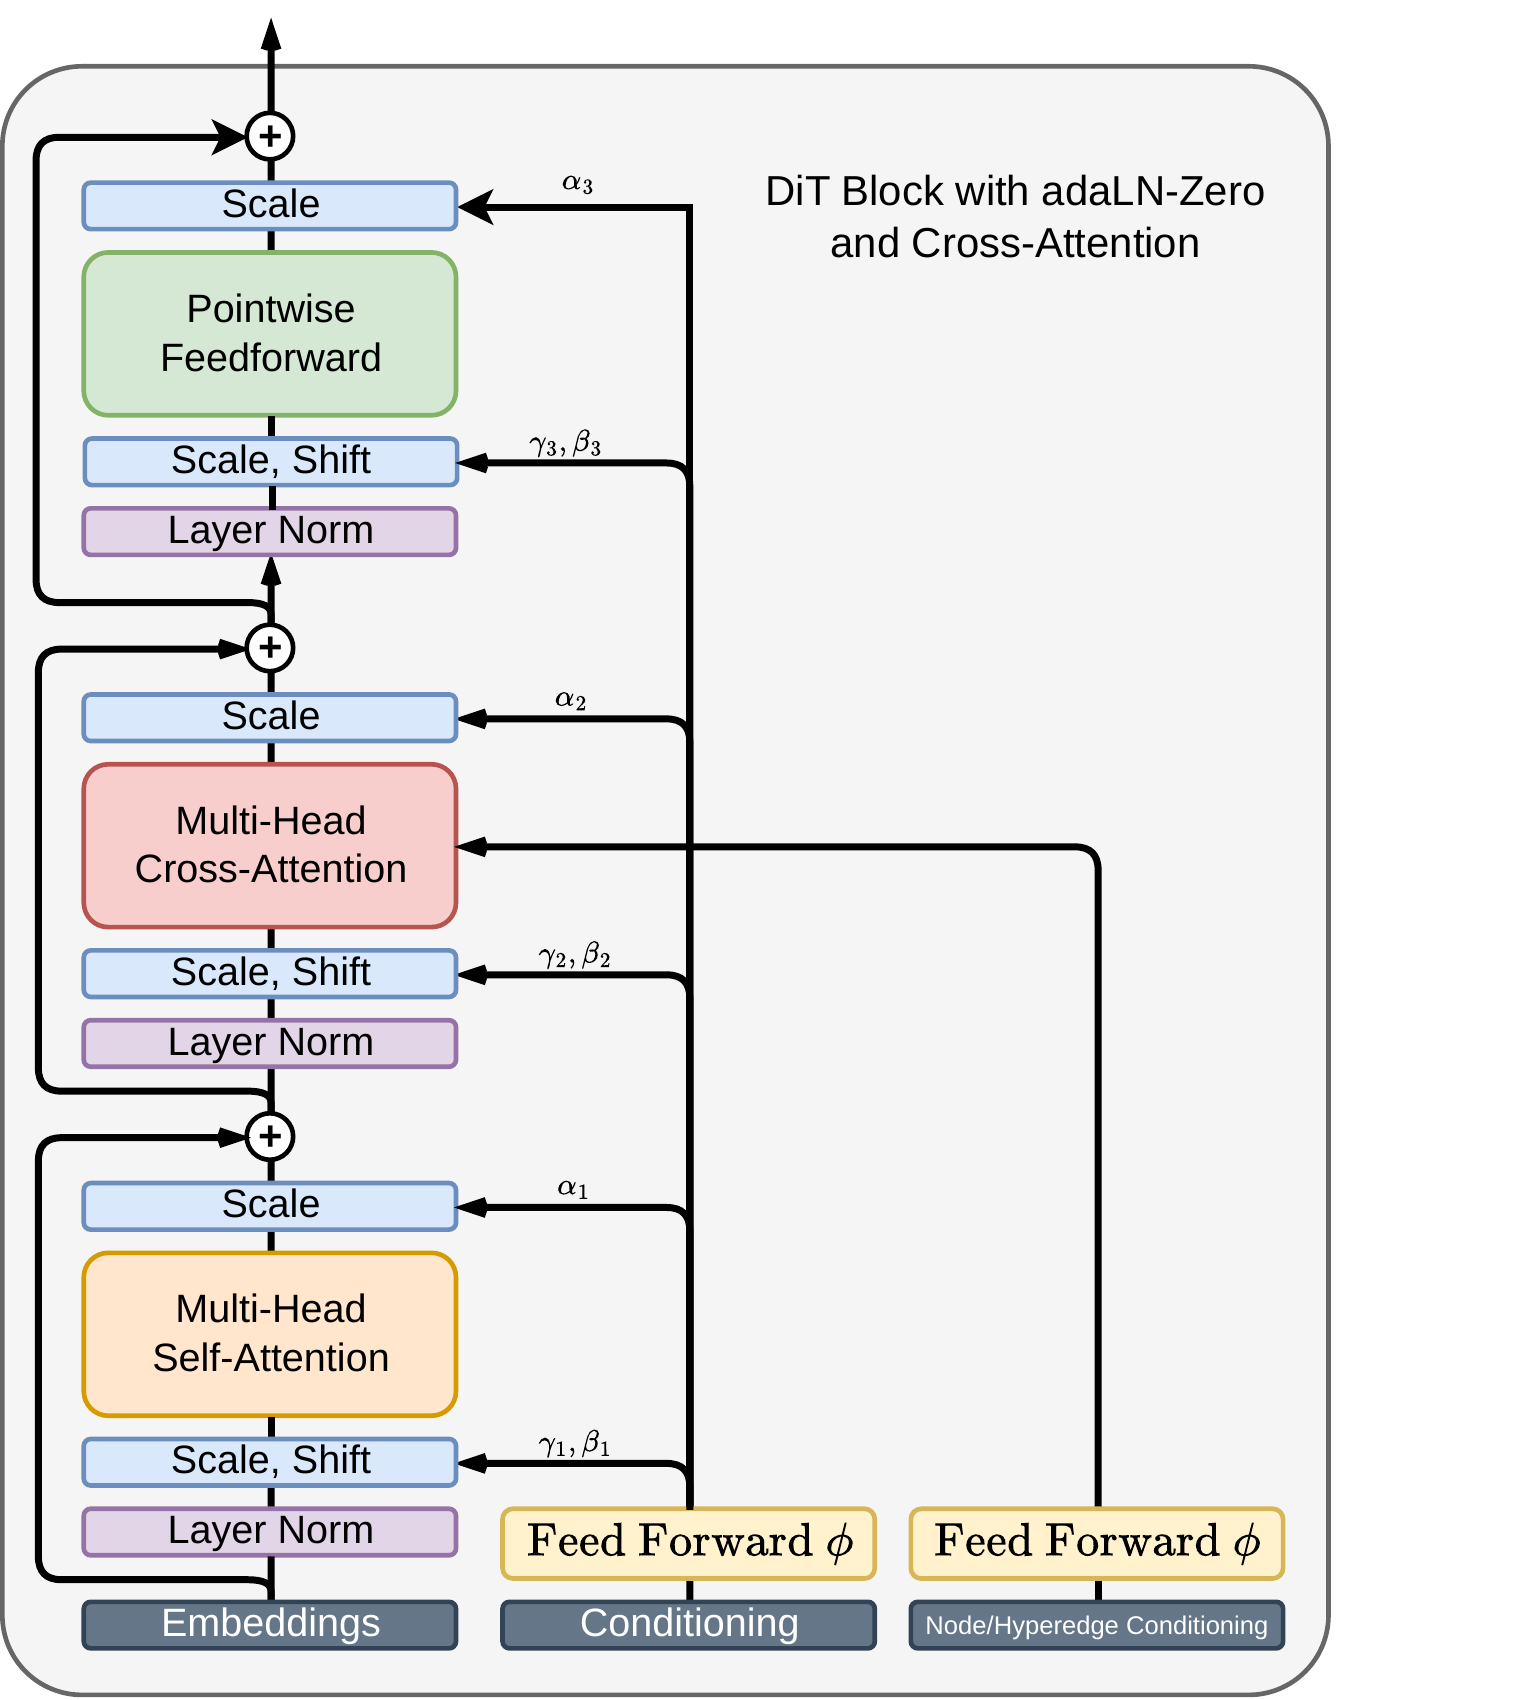
Paired diffusion transformers denoise both latent streams while exchanging information through cross-attention.
Decode synthetic sub-hypergraphs and reconcile entities for full hypergraph generation. Janus generates nodes and hyperedges; JanusNC works with a prescribed node set.
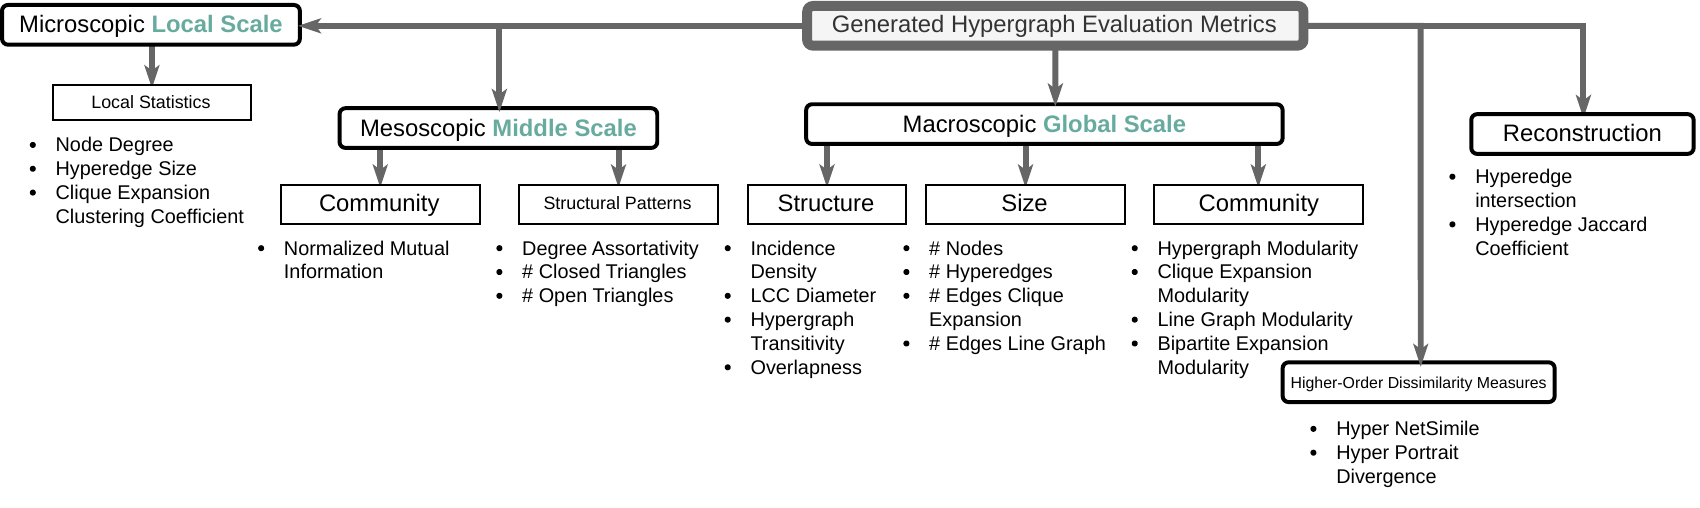
Node degree, hyperedge size and clustering-coefficient distributions.
Community structure, degree assortativity and open/closed triangles.
Global size, connectivity, transitivity, overlapness and modularity.
Hyper NetSimile, Hyperedge Portrait Divergence and reconstruction under fixed nodes.
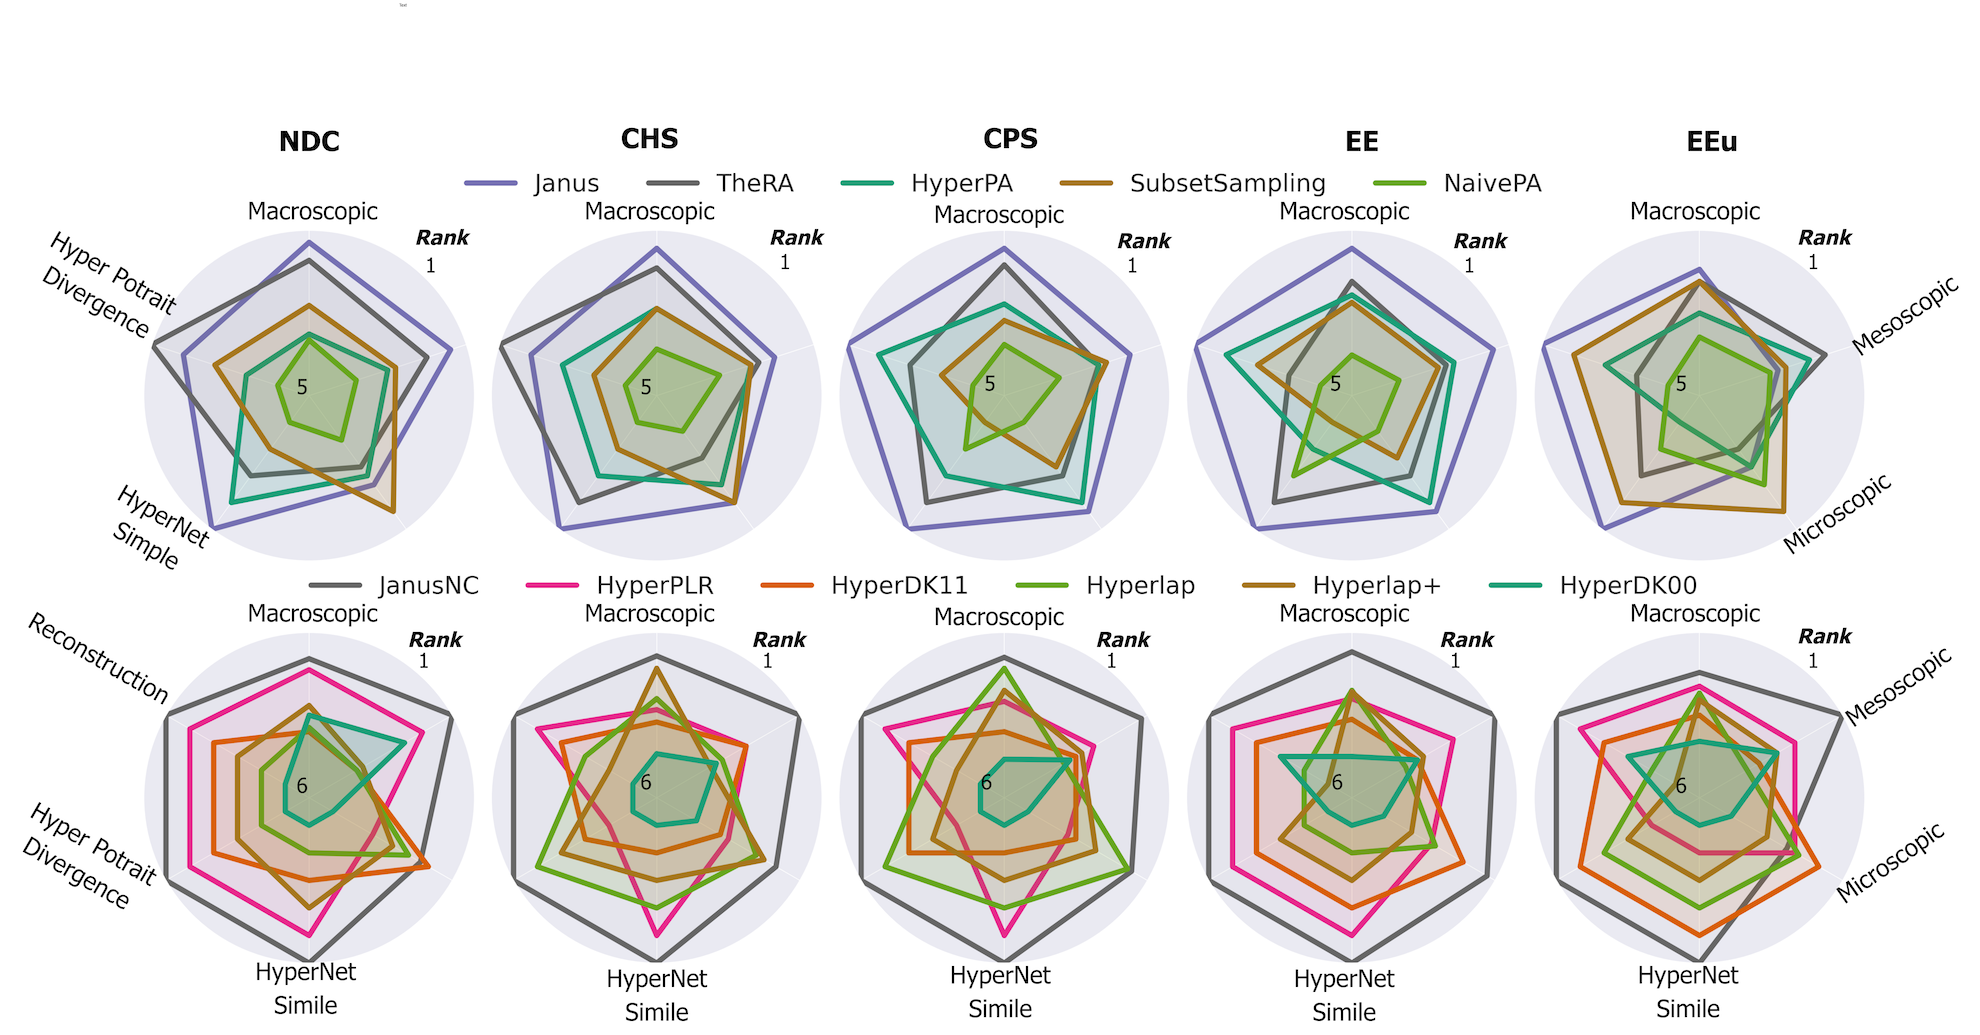
Evaluated on five real-world datasets against nine baseline methods, using microscopic, mesoscopic, macroscopic and higher-order similarity metrics.
Janus performs consistently across scales, with particularly strong mesoscopic organization and higher-order structural similarity. Some local metrics on email-Eu remain challenging; full per-dataset tables are available below.
JanusNC versus 2.07 for HyperPLR. Lower is better.
JanusNC versus 0.0292 for HyperLap. Lower is better.
JanusNC versus 0.1613 for HyperPLR. Higher is better.
Removing cross-attention increases Hyper Portrait Divergence from 0.1158 to 0.1924, and Hyper NetSimile from 0.8984 to 1.6320 on the email-Enron ablation. Coupled denoising helps maintain high-order structure.
Detailed numerical results from the paper and supplementary material. Expand a category, then a table to inspect the results.
| Size | # Layers | # Heads | Hidden size | Latent dim. |
| S | 1 | 2 | 128 | 128 |
| M | 2 | 4 | 256 | 128 |
| Size | # Layers | # Heads | Hidden size | Latent dim. |
| S | 4 | 2 | 256 | 128 |
| M | 8 | 4 | 512 | 128 |
| Abbreviation | Dataset | |V| | |E| | # Connected Components |
| NDC | NDC-classes | 1,161 | 1,088 | 183 |
| CHS | contact-high-school | 327 | 7,818 | 1 |
| CPS | contact-primary-school | 242 | 12,704 | 1 |
| EE | email-Enron | 143 | 1,512 | 1 |
| EEu | email-Eu | 998 | 25,027 | 20 |
Microscopic local statistics performance comparison on the NDC-classes dataset. Methods are grouped by kind. Reported metrics: Clique Exp. Avg. Clustering (lower is better), Node Degree Dist. (lower is better), Hyperedge Size Dist. (lower is better).
| Model | Clique Exp. Avg. Clustering | Node Degree Dist. | Hyperedge Size Dist. | Avg. Rank | |||||
| 5cunconstrained | |||||||||
| SubsetSampling | 0.0888 ± 0.0096 | 4.7782 ± 0.8253 | 0.1899 ± 0.1359 | 1.6667 | |||||
| Janus | 0.0460 ± 0.0109 | 5.0146 ± 0.6866 | 1.5250 ± 0.2165 | 2.6667 | |||||
| HyperPA | 0.1331 ± 0.0131 | 6.8262 ± 0.7726 | 0.1471 ± 0.0414 | 3.0000 | |||||
| TheRA | 0.1817 | 5.7460 | 0.3604 | 3.3333 | |||||
| NaivePA | 0.2025 ± 0.0118 | 6.5787 ± 0.8933 | 0.9076 ± 0.1805 | 4.3333 | |||||
| 5c(Janus) reconstruction upper bound | |||||||||
| JanusNC--VAE | 0.0003 ± 0.0004 | 0.0215 ± 0.0149 | 0.0099 ± 0.0050 | 1.0000 | |||||
| Janus--VAE | 0.0018 ± 0.0010 | 0.1602 ± 0.0184 | 0.0398 ± 0.0183 | 2.0000 | |||||
| 5cnode-set constrained | |||||||||
| HyperDK11 | 0.1414 ± 0.0040 | 0.1874 ± 0.0119 | 0.1587 ± 0.0049 | 2.0000 | |||||
| JanusNC | 0.0485 ± 0.0046 | 1.3110 ± 0.0678 | 0.5228 ± 0.0487 | 2.3333 | |||||
| Hyperlap | 0.0607 ± 0.0104 | 1.9195 ± 0.1087 | 0.2440 ± 0.0000 | 2.8333 | |||||
| Hyperlap+ | 0.1388 ± 0.0052 | 2.2368 ± 0.0595 | 0.2440 ± 0.0000 | 3.5000 | |||||
| HyperPLR | 0.1796 ± 0.0098 | 1.3261 ± 0.1043 | 1.1018 ± 0.0358 | 4.3333 | |||||
| HyperDK00 | 0.3555 ± 0.0034 | 5.2728 ± 0.0411 | 2.0094 ± 0.0227 | 6.0000 | |||||
Microscopic local statistics performance comparison on the contact-high-school dataset. Methods are grouped by kind. Reported metrics: Clique Exp. Avg. Clustering (lower is better), Node Degree Dist. (lower is better), Hyperedge Size Dist. (lower is
| Model | Clique Exp. Avg. Clustering | Node Degree Dist. | Hyperedge Size Dist. | Avg. Rank | |||||
| 5cunconstrained | |||||||||
| Janus | 0.0315 ± 0.0048 | 2.9524 ± 0.4882 | 0.0690 ± 0.0023 | 2.0000 | |||||
| SubsetSampling | 0.0128 ± 0.0120 | 27.4937 ± 1.9276 | 0.0168 ± 0.0044 | 2.0000 | |||||
| HyperPA | 0.1057 ± 0.0056 | 31.4689 ± 1.5729 | 0.0037 ± 0.0019 | 2.6667 | |||||
| TheRA | 0.1493 | 13.5076 | 0.2823 | 3.6667 | |||||
| NaivePA | 0.1352 ± 0.0127 | 40.6730 ± 2.4702 | 0.9990 ± 0.0084 | 4.6667 | |||||
| 5c(Janus) reconstruction upper bound | |||||||||
| JanusNC--VAE | 0.0003 ± 0.0004 | 0.1058 ± 0.0195 | 0.0016 ± 0.0004 | 1.0000 | |||||
| Janus--VAE | 0.0020 ± 0.0004 | 0.4606 ± 0.0672 | 0.0070 ± 0.0009 | 2.0000 | |||||
| 5cnode-set constrained | |||||||||
| JanusNC | 0.0074 ± 0.0023 | 0.7314 ± 0.0568 | 0.0245 ± 0.0007 | 2.0000 | |||||
| Hyperlap+ | 0.1287 ± 0.0053 | 1.2159 ± 0.1165 | 0.0000 ± 0.0000 | 2.5000 | |||||
| Hyperlap | 0.1625 ± 0.0039 | 1.0920 ± 0.0585 | 0.0000 ± 0.0000 | 2.8333 | |||||
| HyperPLR | 0.0325 ± 0.0004 | 11.1189 ± 0.2333 | 0.4360 ± 0.0030 | 4.0000 | |||||
| HyperDK11 | 0.2099 ± 0.0020 | 2.5694 ± 0.0745 | 0.0156 ± 0.0007 | 4.3333 | |||||
| HyperDK00 | 0.1614 ± 0.0032 | 16.4820 ± 0.1588 | 0.7773 ± 0.0165 | 5.3333 | |||||
Microscopic local statistics performance comparison on the contact-primary-school dataset. Methods are grouped by kind. Reported metrics: Clique Exp. Avg. Clustering (lower is better), Node Degree Dist. (lower is better), Hyperedge Size Dist. (lower
| Model | Clique Exp. Avg. Clustering | Node Degree Dist. | Hyperedge Size Dist. | Avg. Rank | |||||
| 5cunconstrained | |||||||||
| Janus | 0.0084 ± 0.0020 | 5.5625 ± 0.1461 | 0.0311 ± 0.0032 | 1.6667 | |||||
| HyperPA | 0.0261 ± 0.0131 | 67.0734 ± 0.6297 | 0.0059 ± 0.0056 | 2.0000 | |||||
| TheRA | 0.0799 | 22.9917 | 0.3481 | 3.0000 | |||||
| SubsetSampling | 0.1564 ± 0.0189 | 70.6643 ± 2.9423 | 0.0067 ± 0.0013 | 3.3333 | |||||
| NaivePA | 0.2096 ± 0.0097 | 86.0562 ± 5.0824 | 0.9974 ± 0.0074 | 5.0000 | |||||
| 5c(Janus) reconstruction upper bound | |||||||||
| JanusNC--VAE | 0.0000 ± 0.0000 | 0.1810 ± 0.0486 | 0.0012 ± 0.0002 | 1.0000 | |||||
| Janus--VAE | 0.0009 ± 0.0004 | 1.0091 ± 0.0713 | 0.0063 ± 0.0004 | 2.0000 | |||||
| 5cnode-set constrained | |||||||||
| JanusNC | 0.0038 ± 0.0015 | 2.1124 ± 0.0861 | 0.0219 ± 0.0009 | 1.6667 | |||||
| Hyperlap | 0.0292 ± 0.0009 | 2.2926 ± 0.3851 | 0.0000 ± 0.0000 | 1.8333 | |||||
| Hyperlap+ | 0.1290 ± 0.0229 | 4.3504 ± 1.1593 | 0.0000 ± 0.0000 | 3.1667 | |||||
| HyperDK11 | 0.0686 ± 0.0019 | 10.7215 ± 0.2688 | 0.0415 ± 0.0012 | 4.0000 | |||||
| HyperPLR | 0.0345 ± 0.0000 | 16.0023 ± 0.4694 | 0.2867 ± 0.0041 | 4.3333 | |||||
| HyperDK00 | 0.1923 ± 0.0027 | 37.8463 ± 0.4755 | 0.7498 ± 0.0061 | 6.0000 | |||||
Microscopic local statistics performance comparison on the email-Enron dataset. Methods are grouped by kind. Reported metrics: Clique Exp. Avg. Clustering (lower is better), Node Degree Dist. (lower is better), Hyperedge Size Dist. (lower is better).
| Model | Clique Exp. Avg. Clustering | Node Degree Dist. | Hyperedge Size Dist. | Avg. Rank | |||||
| 5cunconstrained | |||||||||
| Janus | 0.0112 ± 0.0054 | 3.5287 ± 0.3674 | 0.3067 ± 0.0390 | 1.6667 | |||||
| HyperPA | 0.0734 ± 0.0403 | 11.7011 ± 1.3787 | 0.0616 ± 0.0376 | 2.0000 | |||||
| TheRA | 0.0805 | 10.6294 | 0.3776 | 3.0000 | |||||
| SubsetSampling | 0.1391 ± 0.0114 | 13.8181 ± 1.5490 | 0.0883 ± 0.0253 | 3.6667 | |||||
| NaivePA | 0.1589 ± 0.0112 | 12.8113 ± 2.5531 | 0.9956 ± 0.0580 | 4.6667 | |||||
| 5c(Janus) reconstruction upper bound | |||||||||
| JanusNC--VAE | 0.0004 ± 0.0009 | 0.0448 ± 0.0607 | 0.0024 ± 0.0033 | 1.0000 | |||||
| Janus--VAE | 0.0014 ± 0.0016 | 0.0937 ± 0.0663 | 0.0035 ± 0.0027 | 2.0000 | |||||
| 5cnode-set constrained | |||||||||
| JanusNC | 0.0021 ± 0.0018 | 0.8478 ± 0.1101 | 0.0493 ± 0.0064 | 1.3333 | |||||
| HyperDK11 | 0.0414 ± 0.0052 | 1.5804 ± 0.1058 | 0.0513 ± 0.0095 | 2.3333 | |||||
| Hyperlap | 0.0524 ± 0.0087 | 2.5836 ± 0.3062 | 0.1217 ± 0.0000 | 3.5000 | |||||
| HyperPLR | 0.0010 ± 0.0009 | 3.2313 ± 0.1835 | 0.4610 ± 0.0112 | 3.6667 | |||||
| Hyperlap+ | 0.2479 ± 0.0132 | 2.6126 ± 0.5885 | 0.1217 ± 0.0000 | 4.5000 | |||||
| HyperDK00 | 0.0868 ± 0.0029 | 14.4014 ± 0.2962 | 0.6538 ± 0.0255 | 5.6667 | |||||
Microscopic local statistics performance comparison on the email-Eu dataset. Methods are grouped by kind. Reported metrics: Clique Exp. Avg. Clustering (lower is better), Node Degree Dist. (lower is better), Hyperedge Size Dist. (lower is better). Co
| Model | Clique Exp. Avg. Clustering | Node Degree Dist. | Hyperedge Size Dist. | Avg. Rank | |||||
| 5cunconstrained | |||||||||
| SubsetSampling | 0.1597 ± 0.0130 | 30.5596 ± 5.3939 | 0.0275 ± 0.0073 | 1.6667 | |||||
| NaivePA | 0.2368 ± 0.0048 | 49.8866 ± 2.2798 | 0.9942 ± 0.0263 | 2.6667 | |||||
| HyperPA | 0.3406 ± 0.0116 | 81.1249 ± 0.6443 | 0.0181 ± 0.0052 | 3.3333 | |||||
| Janus | 0.1319 ± 0.0023 | 64.0602 ± 0.7441 | 2.1892 ± 0.0087 | 3.3333 | |||||
| TheRA | 0.3454 | 62.4391 | 1.2707 | 4.0000 | |||||
| 5c(Janus) reconstruction upper bound | |||||||||
| JanusNC--VAE | 0.0004 ± 0.0003 | 0.6631 ± 0.1053 | 0.0135 ± 0.0027 | 1.0000 | |||||
| Janus--VAE | 0.0030 ± 0.0025 | 3.8457 ± 0.2356 | 0.0843 ± 0.0067 | 2.0000 | |||||
| 5cnode-set constrained | |||||||||
| HyperDK11 | 0.1710 ± 0.0047 | 2.9966 ± 0.1062 | 0.0803 ± 0.0025 | 2.0000 | |||||
| Hyperlap | 0.1310 ± 0.0023 | 9.4033 ± 0.5780 | 0.1950 ± 0.0000 | 2.8333 | |||||
| HyperPLR | 0.0455 ± 0.0025 | 6.4337 ± 0.5677 | 0.9769 ± 0.0014 | 3.0000 | |||||
| JanusNC | 0.0286 ± 0.0059 | 23.5887 ± 0.5009 | 0.7265 ± 0.0072 | 3.3333 | |||||
| Hyperlap+ | 0.2936 ± 0.0044 | 9.9931 ± 0.4616 | 0.1950 ± 0.0000 | 4.1667 | |||||
| HyperDK00 | 0.2261 ± 0.0010 | 71.7068 ± 0.1027 | 0.9839 ± 0.0109 | 5.6667 | |||||
Mesoscopic community performance comparison on the NDC-classes dataset. Methods are grouped by kind. Reported metrics: Normalized Mutual Information (higher is better). Colored cells mark the top three values within each kind for ranked metrics (gree
| Model | Normalized Mutual Information | Avg. Rank | |||||||
| 3c(Janus) reconstruction upper bound | |||||||||
| JanusNC--VAE | 0.8035 ± 0.0597 | 1.0000 | |||||||
| Janus--VAE | 0.5945 ± 0.0903 | 2.0000 | |||||||
| 3cnode-set constrained | |||||||||
| JanusNC | 0.4520 ± 0.0104 | 1.0000 | |||||||
| HyperPLR | 0.3794 ± 0.0107 | 2.0000 | |||||||
| HyperDK00 | 0.2567 ± 0.0017 | 3.0000 | |||||||
| HyperDK11 | 0.2466 ± 0.0094 | 4.0000 | |||||||
| Hyperlap+ | 0.2382 ± 0.0014 | 5.0000 | |||||||
| Hyperlap | 0.1882 ± 0.0055 | 6.0000 | |||||||
Mesoscopic community performance comparison on the contact-high-school dataset. Methods are grouped by kind. Reported metrics: Normalized Mutual Information (higher is better). Colored cells mark the top three values within each kind for ranked metri
| Model | Normalized Mutual Information | Avg. Rank | |||||||
| 3c(Janus) reconstruction upper bound | |||||||||
| JanusNC--VAE | 0.8561 ± 0.0000 | 1.0000 | |||||||
| Janus--VAE | 0.6284 ± 0.3043 | 2.0000 | |||||||
| 3cnode-set constrained | |||||||||
| JanusNC | 0.1266 ± 0.0352 | 1.0000 | |||||||
| HyperDK00 | 0.0414 ± 0.0053 | 2.0000 | |||||||
| HyperDK11 | 0.0323 ± 0.0110 | 3.0000 | |||||||
| HyperPLR | 0.0289 ± 0.0055 | 4.0000 | |||||||
| Hyperlap | 0.0276 ± 0.0080 | 5.0000 | |||||||
| Hyperlap+ | 0.0219 ± 0.0039 | 6.0000 | |||||||
Mesoscopic community performance comparison on the contact-primary-school dataset. Methods are grouped by kind. Reported metrics: Normalized Mutual Information (higher is better). Colored cells mark the top three values within each kind for ranked me
| Model | Normalized Mutual Information | Avg. Rank | |||||||
| 3c(Janus) reconstruction upper bound | |||||||||
| JanusNC--VAE | 0.6708 ± 0.1868 | 1.0000 | |||||||
| Janus--VAE | 0.3403 ± 0.3302 | 2.0000 | |||||||
| 3cnode-set constrained | |||||||||
| JanusNC | 0.1207 ± 0.0400 | 1.0000 | |||||||
| HyperDK00 | 0.0608 ± 0.0231 | 2.0000 | |||||||
| HyperDK11 | 0.0404 ± 0.0078 | 3.0000 | |||||||
| HyperPLR | 0.0365 ± 0.0048 | 4.0000 | |||||||
| Hyperlap+ | 0.0248 ± 0.0095 | 5.0000 | |||||||
| Hyperlap | 0.0233 ± 0.0062 | 6.0000 | |||||||
Mesoscopic community performance comparison on the email-Enron dataset. Methods are grouped by kind. Reported metrics: Normalized Mutual Information (higher is better). Colored cells mark the top three values within each kind for ranked metrics (gree
| Model | Normalized Mutual Information | Avg. Rank | |||||||
| 3c(Janus) reconstruction upper bound | |||||||||
| JanusNC--VAE | 0.7338 ± 0.0527 | 1.0000 | |||||||
| Janus--VAE | 0.7131 ± 0.1132 | 2.0000 | |||||||
| 3cnode-set constrained | |||||||||
| JanusNC | 0.1417 ± 0.0384 | 1.0000 | |||||||
| HyperDK11 | 0.0839 ± 0.0241 | 2.0000 | |||||||
| HyperPLR | 0.0821 ± 0.0160 | 3.0000 | |||||||
| HyperDK00 | 0.0723 ± 0.0209 | 4.0000 | |||||||
| Hyperlap+ | 0.0599 ± 0.0206 | 5.0000 | |||||||
| Hyperlap | 0.0564 ± 0.0167 | 6.0000 | |||||||
Mesoscopic community performance comparison on the email-Eu dataset. Methods are grouped by kind. Reported metrics: Normalized Mutual Information (higher is better). Colored cells mark the top three values within each kind for ranked metrics (green b
| Model | Normalized Mutual Information | Avg. Rank | |||||||
| 3c(Janus) reconstruction upper bound | |||||||||
| JanusNC--VAE | 0.4873 ± 0.1893 | 1.0000 | |||||||
| Janus--VAE | 0.0754 ± 0.0317 | 2.0000 | |||||||
| 3cnode-set constrained | |||||||||
| JanusNC | 0.0562 ± 0.0064 | 1.0000 | |||||||
| HyperDK11 | 0.0378 ± 0.0033 | 2.0000 | |||||||
| HyperPLR | 0.0371 ± 0.0012 | 3.0000 | |||||||
| HyperDK00 | 0.0320 ± 0.0017 | 4.0000 | |||||||
| Hyperlap+ | 0.0291 ± 0.0031 | 5.0000 | |||||||
| Hyperlap | 0.0272 ± 0.0022 | 6.0000 | |||||||
Mesoscopic structural patterns performance comparison on the NDC-classes dataset. Methods are grouped by kind. Reported metrics: Hypergraph Degree Assortativity (lower is better), # Closed Triangles (lower is better), # Open Triangles (lower is bette
| Model | Hypergraph Degree Assortativity | # Closed Triangles | # Open Triangles | Avg. Rank | |||||
| 5cunconstrained | |||||||||
| Janus | 0.1666 ± 0.0454 | 1638.8000 ± 1184.8674 | 1229.2000 ± 726.4384 | 1.3333 | |||||
| TheRA | 0.1268 | 63676.0000 | 2717.0000 | 2.6667 | |||||
| HyperPA | 0.5059 ± 0.0100 | 9521.2000 ± 2744.1732 | 4590.0000 ± 864.6465 | 3.3333 | |||||
| SubsetSampling | 0.4480 ± 0.0130 | 42097.0000 ± 5611.2747 | 45282.2000 ± 7923.7922 | 3.3333 | |||||
| NaivePA | 0.4508 ± 0.0101 | 58365.2000 ± 9078.8307 | 83767.2000 ± 16902.7303 | 4.3333 | |||||
| 5c(Janus) reconstruction upper bound | |||||||||
| JanusNC--VAE | 0.0669 ± 0.0171 | 19.2000 ± 31.8700 | 6.4000 ± 9.7365 | 1.3333 | |||||
| Janus--VAE | 0.0392 ± 0.0305 | 349.4000 ± 136.0121 | 60.2000 ± 76.0375 | 1.6667 | |||||
| 5cnode-set constrained | |||||||||
| JanusNC | 0.0450 ± 0.0168 | 69.4000 ± 53.8359 | 11.6000 ± 14.2934 | 1.0000 | |||||
| HyperPLR | 0.2684 ± 0.0040 | 4295.4000 ± 58.1016 | 7115.6000 ± 7.9875 | 2.3333 | |||||
| HyperDK00 | 0.4572 ± 0.0082 | 6289.2000 ± 471.9817 | 3508.8000 ± 280.3457 | 3.0000 | |||||
| Hyperlap | 0.4122 ± 0.0150 | 81836.4000 ± 1011.5262 | 61507.8000 ± 3405.4202 | 4.6667 | |||||
| Hyperlap+ | 0.4580 ± 0.0456 | 66595.0000 ± 1550.1950 | 19531.6000 ± 1953.4395 | 4.6667 | |||||
| HyperDK11 | 0.4794 ± 0.0034 | 60097.6000 ± 1117.6052 | 88940.6000 ± 1430.5832 | 5.3333 | |||||
Mesoscopic structural patterns performance comparison on the contact-high-school dataset. Methods are grouped by kind. Reported metrics: Hypergraph Degree Assortativity (lower is better), # Closed Triangles (lower is better), # Open Triangles (lower
| Model | Hypergraph Degree Assortativity | # Closed Triangles | # Open Triangles | Avg. Rank | |||||
| 5cunconstrained | |||||||||
| Janus | 0.0301 ± 0.0159 | 126.8000 ± 12.4780 | 4793.2000 ± 194.9172 | 1.3333 | |||||
| HyperPA | 0.6444 ± 0.0363 | 269.4000 ± 115.0187 | 4506.4000 ± 3070.5346 | 2.6667 | |||||
| SubsetSampling | 0.1427 ± 0.0241 | 4175.6000 ± 155.7524 | 19932.4000 ± 3405.5564 | 3.3333 | |||||
| TheRA | 0.4547 | 2664.0000 | 18683.0000 | 3.3333 | |||||
| NaivePA | 0.1781 ± 0.0154 | 11815.0000 ± 653.4635 | 190303.0000 ± 13624.2036 | 4.3333 | |||||
| 5c(Janus) reconstruction upper bound | |||||||||
| JanusNC--VAE | 0.0199 ± 0.0237 | 9.4000 ± 3.7815 | 8.6000 ± 8.9051 | 1.3333 | |||||
| Janus--VAE | 0.0176 ± 0.0121 | 72.8000 ± 13.3492 | 52.6000 ± 27.9517 | 1.6667 | |||||
| 5cnode-set constrained | |||||||||
| JanusNC | 0.0186 ± 0.0109 | 7.4000 ± 4.2778 | 1744.2000 ± 107.8643 | 1.0000 | |||||
| HyperPLR | 0.1022 ± 0.0271 | 3122.6000 ± 23.7023 | 13919.8000 ± 78.8365 | 3.0000 | |||||
| HyperDK11 | 0.1544 ± 0.0106 | 638.4000 ± 4.2190 | 47846.2000 ± 737.0853 | 3.3333 | |||||
| Hyperlap | 0.1571 ± 0.0108 | 644.4000 ± 3.9115 | 19855.2000 ± 233.4603 | 4.0000 | |||||
| Hyperlap+ | 0.2067 ± 0.0355 | 640.4000 ± 5.6391 | 31592.6000 ± 1138.7477 | 4.3333 | |||||
| HyperDK00 | 0.1561 ± 0.0047 | 13882.2000 ± 432.7519 | 164168.4000 ± 4677.3007 | 5.3333 | |||||
Mesoscopic structural patterns performance comparison on the contact-primary-school dataset. Methods are grouped by kind. Reported metrics: Hypergraph Degree Assortativity (lower is better), # Closed Triangles (lower is better), # Open Triangles (low
| Model | Hypergraph Degree Assortativity | # Closed Triangles | # Open Triangles | Avg. Rank | |||||
| 5cunconstrained | |||||||||
| Janus | 0.0801 ± 0.0480 | 63.6000 ± 46.4898 | 7019.4000 ± 121.6955 | 1.0000 | |||||
| HyperPA | 0.4062 ± 0.0626 | 392.4000 ± 162.4448 | 10614.8000 ± 6508.8942 | 3.0000 | |||||
| SubsetSampling | 0.1410 ± 0.0288 | 3479.6000 ± 402.7975 | 17587.4000 ± 13833.6117 | 3.0000 | |||||
| TheRA | 0.3084 | 3188.0000 | 23776.0000 | 3.6667 | |||||
| NaivePA | 0.1654 ± 0.0128 | 17966.4000 ± 1516.3582 | 234592.8000 ± 35341.2282 | 4.3333 | |||||
| 5c(Janus) reconstruction upper bound | |||||||||
| JanusNC--VAE | 0.0397 ± 0.0297 | 16.2000 ± 3.6332 | 34.6000 ± 36.6920 | 1.3333 | |||||
| Janus--VAE | 0.0196 ± 0.0190 | 110.6000 ± 5.8566 | 472.6000 ± 139.8689 | 1.6667 | |||||
| 5cnode-set constrained | |||||||||
| JanusNC | 0.0589 ± 0.0234 | 29.8000 ± 10.1833 | 3024.2000 ± 568.3350 | 1.3333 | |||||
| HyperPLR | 0.0132 ± 0.0103 | 3094.8000 ± 52.2752 | 39809.8000 ± 52.2752 | 3.0000 | |||||
| Hyperlap+ | 0.1667 ± 0.0083 | 159.0000 ± 49.4823 | 29547.6000 ± 15052.6589 | 3.3333 | |||||
| Hyperlap | 0.1570 ± 0.0102 | 653.8000 ± 14.1315 | 41781.6000 ± 1997.6253 | 4.0000 | |||||
| HyperDK11 | 0.1560 ± 0.0060 | 835.2000 ± 6.3008 | 270809.0000 ± 2079.5510 | 4.3333 | |||||
| HyperDK00 | 0.1463 ± 0.0055 | 23663.8000 ± 649.0498 | 729303.0000 ± 9079.2175 | 5.0000 | |||||
Mesoscopic structural patterns performance comparison on the email-Enron dataset. Methods are grouped by kind. Reported metrics: Hypergraph Degree Assortativity (lower is better), # Closed Triangles (lower is better), # Open Triangles (lower is bette
| Model | Hypergraph Degree Assortativity | # Closed Triangles | # Open Triangles | Avg. Rank | |||||
| 5cunconstrained | |||||||||
| Janus | 0.0225 ± 0.0173 | 115.2000 ± 111.5267 | 52.8000 ± 32.5223 | 1.0000 | |||||
| HyperPA | 0.3035 ± 0.0161 | 2788.2000 ± 642.6027 | 3021.6000 ± 1355.3648 | 3.0000 | |||||
| SubsetSampling | 0.1923 ± 0.0310 | 4195.6000 ± 947.8480 | 6291.6000 ± 1888.3376 | 3.0000 | |||||
| TheRA | 0.0672 | 15588.0000 | 8665.0000 | 3.6667 | |||||
| NaivePA | 0.2913 ± 0.0099 | 4252.0000 ± 998.4415 | 21891.2000 ± 3146.9657 | 4.3333 | |||||
| 5c(Janus) reconstruction upper bound | |||||||||
| JanusNC--VAE | 0.0368 ± 0.0115 | 9.0000 ± 20.1246 | 4.8000 ± 10.7331 | 1.3333 | |||||
| Janus--VAE | 0.0562 ± 0.0316 | 2.4000 ± 2.3022 | 6.8000 ± 8.1056 | 1.6667 | |||||
| 5cnode-set constrained | |||||||||
| JanusNC | 0.0367 ± 0.0202 | 4.8000 ± 4.7645 | 81.8000 ± 24.8938 | 1.0000 | |||||
| HyperPLR | 0.1523 ± 0.0124 | 1465.0000 ± 37.7624 | 2011.2000 ± 58.4953 | 2.6667 | |||||
| Hyperlap+ | 0.2685 ± 0.0170 | 13682.8000 ± 758.4070 | 1323.6000 ± 308.0321 | 3.6667 | |||||
| HyperDK00 | 0.2760 ± 0.0156 | 208.4000 ± 114.8011 | 46651.0000 ± 838.4211 | 4.3333 | |||||
| Hyperlap | 0.2677 ± 0.0115 | 16949.6000 ± 536.6850 | 15849.4000 ± 2582.9575 | 4.3333 | |||||
| HyperDK11 | 0.2845 ± 0.0091 | 4066.2000 ± 160.9323 | 37831.4000 ± 974.1536 | 5.0000 | |||||
Mesoscopic structural patterns performance comparison on the email-Eu dataset. Methods are grouped by kind. Reported metrics: Hypergraph Degree Assortativity (lower is better), # Closed Triangles (lower is better), # Open Triangles (lower is better).
| Model | Hypergraph Degree Assortativity | # Closed Triangles | # Open Triangles | Avg. Rank | |||||
| 5cunconstrained | |||||||||
| HyperPA | 0.2943 ± 0.0130 | 68808.6000 ± 3983.7970 | 89072.8000 ± 13519.0941 | 2.3333 | |||||
| TheRA | 0.0184 | 727153.0000 | 745023.0000 | 2.3333 | |||||
| SubsetSampling | 0.1863 ± 0.0163 | 252536.0000 ± 14546.0439 | 1460210.8000 ± 200863.4878 | 2.6667 | |||||
| NaivePA | 0.1972 ± 0.0088 | 314780.2000 ± 13796.5497 | 2009051.8000 ± 73805.9843 | 3.6667 | |||||
| Janus | 0.0377 ± 0.0121 | 792608.6667 ± 27584.7766 | 2876772.6667 ± 41937.5387 | 4.0000 | |||||
| 5c(Janus) reconstruction upper bound | |||||||||
| JanusNC--VAE | 0.0713 ± 0.0404 | 840.4000 ± 251.3708 | 1087.8000 ± 417.5598 | 1.3333 | |||||
| Janus--VAE | 0.0649 ± 0.0464 | 17319.6000 ± 1658.2421 | 100531.6000 ± 8921.3966 | 1.6667 | |||||
| 5cnode-set constrained | |||||||||
| JanusNC | 0.1381 ± 0.0422 | 2448.6000 ± 1077.1770 | 59049.4000 ± 1885.1407 | 1.0000 | |||||
| HyperPLR | 0.2044 ± 0.0086 | 127367.4000 ± 155.7861 | 165975.6000 ± 1367.2133 | 3.0000 | |||||
| Hyperlap+ | 0.1762 ± 0.0355 | 504741.4000 ± 11561.8625 | 673393.8000 ± 20347.2001 | 3.3333 | |||||
| HyperDK00 | 0.2067 ± 0.0023 | 5562.0000 ± 1384.6366 | 2467127.0000 ± 29901.9227 | 3.6667 | |||||
| Hyperlap | 0.1974 ± 0.0065 | 718826.6000 ± 15624.4865 | 2837196.4000 ± 115211.6587 | 4.6667 | |||||
| HyperDK11 | 0.2148 ± 0.0007 | 417648.4000 ± 4489.0074 | 5279779.4000 ± 22907.1066 | 5.3333 | |||||
Macroscopic community performance comparison on the NDC-classes dataset. Methods are grouped by kind. Reported metrics: Clique Exp. Modularity (lower is better), Hypergraph Modularity (lower is better), Bipartite Modularity (lower is better), Line Gr
| Model | Clique Exp. Modularity | Hypergraph Modularity | Bipartite Modularity | Line Graph Modularity | Avg. Rank | ||||
| 6cunconstrained | |||||||||
| Janus | 0.0715 ± 0.0122 | 0.1282 ± 0.0188 | 0.1147 ± 0.0175 | 0.1099 ± 0.0210 | 1.0000 | ||||
| TheRA | 0.0938 | 0.1881 | 0.1516 | 0.1519 | 2.0000 | ||||
| SubsetSampling | 0.4472 ± 0.0123 | 0.4062 ± 0.0297 | 0.3553 ± 0.0232 | 0.3567 ± 0.0236 | 3.0000 | ||||
| HyperPA | 0.4777 ± 0.0098 | 0.5045 ± 0.0212 | 0.4701 ± 0.0126 | 0.4673 ± 0.0115 | 4.2500 | ||||
| NaivePA | 0.5047 ± 0.0070 | 0.5370 ± 0.0173 | 0.4691 ± 0.0123 | 0.4685 ± 0.0139 | 4.7500 | ||||
| 6c(Janus) reconstruction upper bound | |||||||||
| JanusNC--VAE | 0.0031 ± 0.0026 | 0.0059 ± 0.0028 | 0.0028 ± 0.0016 | 0.0016 ± 0.0011 | 1.2500 | ||||
| Janus--VAE | 0.0064 ± 0.0062 | 0.0060 ± 0.0027 | 0.0017 ± 0.0009 | 0.0019 ± 0.0009 | 1.7500 | ||||
| 6cnode-set constrained | |||||||||
| HyperPLR | 0.0128 ± 0.0068 | 0.0198 ± 0.0042 | 0.0121 ± 0.0102 | 0.0072 ± 0.0032 | 1.5000 | ||||
| JanusNC | 0.0119 ± 0.0035 | 0.0111 ± 0.0041 | 0.0154 ± 0.0024 | 0.0138 ± 0.0013 | 1.5000 | ||||
| Hyperlap+ | 0.1821 ± 0.0488 | 0.1187 ± 0.0279 | 0.0943 ± 0.0332 | 0.0920 ± 0.0366 | 3.2500 | ||||
| Hyperlap | 0.1571 ± 0.0195 | 0.1497 ± 0.0139 | 0.1632 ± 0.0171 | 0.1581 ± 0.0164 | 3.7500 | ||||
| HyperDK00 | 0.3818 ± 0.0050 | 0.3813 ± 0.0052 | 0.3394 ± 0.0025 | 0.3408 ± 0.0025 | 5.0000 | ||||
| HyperDK11 | 0.4252 ± 0.0057 | 0.4151 ± 0.0084 | 0.3439 ± 0.0018 | 0.3440 ± 0.0016 | 6.0000 | ||||
Macroscopic community performance comparison on the contact-high-school dataset. Methods are grouped by kind. Reported metrics: Clique Exp. Modularity (lower is better), Hypergraph Modularity (lower is better), Bipartite Modularity (lower is better),
| Model | Clique Exp. Modularity | Hypergraph Modularity | Bipartite Modularity | Line Graph Modularity | Avg. Rank | ||||
| 6cunconstrained | |||||||||
| Janus | 0.0109 ± 0.0058 | 0.0450 ± 0.0034 | 0.0116 ± 0.0056 | 0.0044 ± 0.0019 | 1.0000 | ||||
| TheRA | 0.1980 | 0.0776 | 0.0784 | 0.0783 | 2.0000 | ||||
| HyperPA | 0.4910 ± 0.0023 | 0.5052 ± 0.0126 | 0.2841 ± 0.0017 | 0.2838 ± 0.0017 | 3.2500 | ||||
| SubsetSampling | 0.4185 ± 0.0048 | 0.5078 ± 0.0042 | 0.2906 ± 0.0030 | 0.2905 ± 0.0030 | 3.7500 | ||||
| NaivePA | 0.5214 ± 0.0020 | 0.5904 ± 0.0304 | 0.4264 ± 0.0012 | 0.4261 ± 0.0018 | 5.0000 | ||||
| 6c(Janus) reconstruction upper bound | |||||||||
| JanusNC--VAE | 0.0009 ± 0.0002 | 0.0034 ± 0.0044 | 0.0020 ± 0.0016 | 0.0016 ± 0.0011 | 1.2500 | ||||
| Janus--VAE | 0.0047 ± 0.0064 | 0.0029 ± 0.0037 | 0.0026 ± 0.0024 | 0.0027 ± 0.0013 | 1.7500 | ||||
| 6cnode-set constrained | |||||||||
| JanusNC | 0.0011 ± 0.0007 | 0.0189 ± 0.0038 | 0.0005 ± 0.0004 | 0.0040 ± 0.0013 | 1.2500 | ||||
| Hyperlap+ | 0.1608 ± 0.0016 | 0.0776 ± 0.0012 | 0.0052 ± 0.0009 | 0.0037 ± 0.0019 | 2.0000 | ||||
| HyperPLR | 0.0271 ± 0.0016 | 0.1652 ± 0.0021 | 0.1009 ± 0.0055 | 0.1014 ± 0.0032 | 3.0000 | ||||
| Hyperlap | 0.1924 ± 0.0134 | 0.1544 ± 0.0049 | 0.1304 ± 0.0031 | 0.1305 ± 0.0029 | 3.7500 | ||||
| HyperDK11 | 0.4983 ± 0.0034 | 0.5135 ± 0.0021 | 0.2950 ± 0.0002 | 0.2948 ± 0.0005 | 5.2500 | ||||
| HyperDK00 | 0.5154 ± 0.0014 | 0.5110 ± 0.0095 | 0.3778 ± 0.0007 | 0.3773 ± 0.0017 | 5.7500 | ||||
Macroscopic community performance comparison on the contact-primary-school dataset. Methods are grouped by kind. Reported metrics: Clique Exp. Modularity (lower is better), Hypergraph Modularity (lower is better), Bipartite Modularity (lower is bette
| Model | Clique Exp. Modularity | Hypergraph Modularity | Bipartite Modularity | Line Graph Modularity | Avg. Rank | ||||
| 6cunconstrained | |||||||||
| Janus | 0.0119 ± 0.0025 | 0.0224 ± 0.0018 | 0.0103 ± 0.0016 | 0.0109 ± 0.0024 | 1.0000 | ||||
| TheRA | 0.1358 | 0.1713 | 0.1219 | 0.1224 | 2.0000 | ||||
| HyperPA | 0.2179 ± 0.0057 | 0.3517 ± 0.0297 | 0.2008 ± 0.0032 | 0.2004 ± 0.0021 | 3.2500 | ||||
| SubsetSampling | 0.1531 ± 0.0101 | 0.3656 ± 0.0126 | 0.2102 ± 0.0020 | 0.2101 ± 0.0013 | 3.7500 | ||||
| NaivePA | 0.2409 ± 0.0020 | 0.3951 ± 0.0142 | 0.3309 ± 0.0009 | 0.3308 ± 0.0010 | 5.0000 | ||||
| 6c(Janus) reconstruction upper bound | |||||||||
| Janus--VAE | 0.0010 ± 0.0003 | 0.0002 ± 0.0001 | 0.0007 ± 0.0006 | 0.0016 ± 0.0012 | 1.5000 | ||||
| JanusNC--VAE | 0.0001 ± 0.0001 | 0.0002 ± 0.0002 | 0.0010 ± 0.0009 | 0.0008 ± 0.0006 | 1.5000 | ||||
| 6cnode-set constrained | |||||||||
| JanusNC | 0.0058 ± 0.0030 | 0.0123 ± 0.0009 | 0.0023 ± 0.0007 | 0.0031 ± 0.0030 | 1.5000 | ||||
| Hyperlap | 0.0034 ± 0.0030 | 0.0549 ± 0.0029 | 0.0156 ± 0.0019 | 0.0165 ± 0.0019 | 2.0000 | ||||
| HyperPLR | 0.0026 ± 0.0009 | 0.0603 ± 0.0031 | 0.0352 ± 0.0018 | 0.0352 ± 0.0015 | 3.0000 | ||||
| Hyperlap+ | 0.2123 ± 0.0006 | 0.0866 ± 0.0083 | 0.0207 ± 0.0141 | 0.0211 ± 0.0142 | 3.5000 | ||||
| HyperDK11 | 0.2402 ± 0.0012 | 0.3610 ± 0.0127 | 0.2159 ± 0.0003 | 0.2155 ± 0.0003 | 5.0000 | ||||
| HyperDK00 | 0.2538 ± 0.0010 | 0.3686 ± 0.0256 | 0.2961 ± 0.0008 | 0.2958 ± 0.0005 | 6.0000 | ||||
Macroscopic community performance comparison on the email-Enron dataset. Methods are grouped by kind. Reported metrics: Clique Exp. Modularity (lower is better), Hypergraph Modularity (lower is better), Bipartite Modularity (lower is better), Line Gr
| Model | Clique Exp. Modularity | Hypergraph Modularity | Bipartite Modularity | Line Graph Modularity | Avg. Rank | ||||
| 6cunconstrained | |||||||||
| Janus | 0.0087 ± 0.0027 | 0.0047 ± 0.0039 | 0.0214 ± 0.0076 | 0.0235 ± 0.0106 | 1.0000 | ||||
| TheRA | 0.1929 | 0.1377 | 0.0779 | 0.0734 | 2.2500 | ||||
| HyperPA | 0.2297 ± 0.0136 | 0.3770 ± 0.0149 | 0.2626 ± 0.0138 | 0.2575 ± 0.0155 | 3.2500 | ||||
| SubsetSampling | 0.0637 ± 0.0303 | 0.3964 ± 0.0411 | 0.2690 ± 0.0065 | 0.2668 ± 0.0060 | 3.5000 | ||||
| NaivePA | 0.2737 ± 0.0051 | 0.4661 ± 0.0343 | 0.3612 ± 0.0059 | 0.3596 ± 0.0063 | 5.0000 | ||||
| 6c(Janus) reconstruction upper bound | |||||||||
| Janus--VAE | 0.0096 ± 0.0072 | 0.0006 ± 0.0003 | 0.0014 ± 0.0009 | 0.0030 ± 0.0033 | 1.5000 | ||||
| JanusNC--VAE | 0.0068 ± 0.0036 | 0.0003 ± 0.0002 | 0.0050 ± 0.0046 | 0.0068 ± 0.0032 | 1.5000 | ||||
| 6cnode-set constrained | |||||||||
| JanusNC | 0.0067 ± 0.0035 | 0.0042 ± 0.0018 | 0.0060 ± 0.0025 | 0.0069 ± 0.0045 | 1.2500 | ||||
| Hyperlap | 0.0693 ± 0.0459 | 0.0246 ± 0.0065 | 0.0808 ± 0.0126 | 0.0775 ± 0.0117 | 2.2500 | ||||
| HyperPLR | 0.0060 ± 0.0035 | 0.0794 ± 0.0109 | 0.0901 ± 0.0035 | 0.0852 ± 0.0041 | 3.0000 | ||||
| Hyperlap+ | 0.2379 ± 0.0085 | 0.2047 ± 0.0010 | 0.0817 ± 0.0013 | 0.0846 ± 0.0013 | 3.5000 | ||||
| HyperDK11 | 0.2666 ± 0.0025 | 0.3731 ± 0.0044 | 0.2771 ± 0.0010 | 0.2755 ± 0.0021 | 5.0000 | ||||
| HyperDK00 | 0.2724 ± 0.0027 | 0.4176 ± 0.0474 | 0.2969 ± 0.0021 | 0.2950 ± 0.0021 | 6.0000 | ||||
Macroscopic community performance comparison on the email-Eu dataset. Methods are grouped by kind. Reported metrics: Clique Exp. Modularity (lower is better), Hypergraph Modularity (lower is better), Bipartite Modularity (lower is better), Line Graph
| Model | Clique Exp. Modularity | Hypergraph Modularity | Bipartite Modularity | Line Graph Modularity | Avg. Rank | ||||
| 6cunconstrained | |||||||||
| Janus | 0.1156 ± 0.0076 | 0.0174 ± 0.0044 | 0.1060 ± 0.0017 | 0.1067 ± 0.0020 | 1.0000 | ||||
| TheRA | 0.2714 | 0.2836 | 0.1133 | 0.1169 | 2.0000 | ||||
| SubsetSampling | 0.3097 ± 0.0031 | 0.4463 ± 0.0258 | 0.3493 ± 0.0034 | 0.3507 ± 0.0035 | 3.2500 | ||||
| HyperPA | 0.2992 ± 0.0036 | 0.5012 ± 0.0315 | 0.3629 ± 0.0013 | 0.3641 ± 0.0014 | 3.7500 | ||||
| NaivePA | 0.3132 ± 0.0051 | 0.5091 ± 0.0077 | 0.4267 ± 0.0017 | 0.4275 ± 0.0018 | 5.0000 | ||||
| 6c(Janus) reconstruction upper bound | |||||||||
| JanusNC--VAE | 0.0019 ± 0.0007 | 0.0017 ± 0.0014 | 0.0031 ± 0.0014 | 0.0022 ± 0.0007 | 1.2500 | ||||
| Janus--VAE | 0.0089 ± 0.0046 | 0.0012 ± 0.0008 | 0.0135 ± 0.0077 | 0.0033 ± 0.0024 | 1.7500 | ||||
| 6cnode-set constrained | |||||||||
| JanusNC | 0.0193 ± 0.0042 | 0.0667 ± 0.0048 | 0.0397 ± 0.0029 | 0.0459 ± 0.0038 | 1.2500 | ||||
| Hyperlap | 0.0924 ± 0.0091 | 0.0067 ± 0.0013 | 0.1079 ± 0.0043 | 0.1084 ± 0.0042 | 2.5000 | ||||
| HyperPLR | 0.0569 ± 0.0044 | 0.1864 ± 0.0085 | 0.1863 ± 0.0033 | 0.1869 ± 0.0048 | 3.2500 | ||||
| Hyperlap+ | 0.3728 ± 0.0012 | 0.2249 ± 0.0020 | 0.0686 ± 0.0042 | 0.0727 ± 0.0030 | 3.5000 | ||||
| HyperDK00 | 0.3260 ± 0.0006 | 0.4256 ± 0.0056 | 0.3768 ± 0.0006 | 0.3777 ± 0.0007 | 5.2500 | ||||
| HyperDK11 | 0.3327 ± 0.0012 | 0.4420 ± 0.0083 | 0.3635 ± 0.0002 | 0.3649 ± 0.0004 | 5.2500 | ||||
Macroscopic structure performance comparison on the NDC-classes dataset. Methods are grouped by kind. Reported metrics: Incidence Matrix Density (lower is better), LCC Diameter (lower is better), Clique Exp. # Edges (lower is better), Line Graph # Ed
| Model | Incidence Matrix Density | LCC Diameter | Clique Exp. # Edges | Line Graph # Edges | Avg. Rank | ||||
| 6cunconstrained | |||||||||
| Janus | 0.0046 ± 0.0006 | 0.8000 ± 0.4472 | 159.0000 ± 142.0194 | 82433.8000 ± 15422.4404 | 1.5000 | ||||
| TheRA | 0.0004 | 2.0000 | 10166.0000 | 25451.0000 | 2.2500 | ||||
| SubsetSampling | 0.0046 ± 0.0006 | 4.0000 ± 0.0000 | 4380.8000 ± 646.1391 | 97821.0000 ± 40655.9604 | 3.0000 | ||||
| HyperPA | 0.0049 ± 0.0003 | 5.0000 ± 0.0000 | 1851.4000 ± 367.2285 | 214178.8000 ± 62837.8174 | 3.8750 | ||||
| NaivePA | 0.0063 ± 0.0002 | 5.0000 ± 0.0000 | 5856.8000 ± 914.3502 | 180947.8000 ± 53300.6257 | 4.3750 | ||||
| 6c(Janus) reconstruction upper bound | |||||||||
| JanusNC--VAE | 0.0000 ± 0.0000 | 0.0000 ± 0.0000 | 5.4000 ± 5.5946 | 375.4000 ± 380.2714 | 1.0000 | ||||
| Janus--VAE | 0.0000 ± 0.0000 | 0.4000 ± 0.8944 | 54.2000 ± 22.5765 | 2107.4000 ± 279.9898 | 2.0000 | ||||
| 6cnode-set constrained | |||||||||
| JanusNC | 0.0012 ± 0.0001 | 0.2000 ± 0.4472 | 98.6000 ± 6.5803 | 11413.0000 ± 751.0310 | 2.2500 | ||||
| HyperPLR | 0.0010 ± 0.0002 | 0.0000 ± 0.0000 | 706.4000 ± 7.4364 | 34292.2000 ± 4907.9905 | 2.5000 | ||||
| Hyperlap+ | 0.0014 ± 0.0000 | 2.6000 ± 0.5477 | 8998.6000 ± 280.6533 | 9905.6000 ± 3257.1133 | 3.2500 | ||||
| HyperDK00 | 0.0000 ± 0.0000 | 4.6000 ± 0.5477 | 12545.0000 ± 69.6671 | 18179.0000 ± 258.0949 | 3.7500 | ||||
| HyperDK11 | 0.0001 ± 0.0000 | 4.2000 ± 0.4472 | 12290.6000 ± 143.4932 | 71341.2000 ± 916.8335 | 4.2500 | ||||
| Hyperlap | 0.0013 ± 0.0001 | 3.8000 ± 0.4472 | 13230.2000 ± 291.4107 | 35283.8000 ± 837.5964 | 5.0000 | ||||
Macroscopic structure performance comparison on the contact-high-school dataset. Methods are grouped by kind. Reported metrics: Incidence Matrix Density (lower is better), LCC Diameter (lower is better), Clique Exp. # Edges (lower is better), Line Gr
| Model | Incidence Matrix Density | LCC Diameter | Clique Exp. # Edges | Line Graph # Edges | Avg. Rank | ||||
| 6cunconstrained | |||||||||
| Janus | 0.0000 ± 0.0000 | 0.8000 ± 0.4472 | 391.6000 ± 35.1184 | 24882.0000 ± 5694.4898 | 1.8750 | ||||
| HyperPA | 0.0002 ± 0.0001 | 0.0000 ± 0.0000 | 616.4000 ± 248.7877 | 734993.2000 ± 70823.9485 | 2.7500 | ||||
| SubsetSampling | 0.0001 ± 0.0001 | 0.2000 ± 0.4472 | 1100.0000 ± 220.3497 | 540273.2000 ± 73085.8941 | 2.7500 | ||||
| TheRA | 0.0009 | 1.0000 | 603.0000 | 12563.0000 | 3.0000 | ||||
| NaivePA | 0.0033 ± 0.0001 | 0.8000 ± 0.4472 | 6396.4000 ± 442.5306 | 2613255.8000 ± 334047.7548 | 4.6250 | ||||
| 6c(Janus) reconstruction upper bound | |||||||||
| JanusNC--VAE | 0.0000 ± 0.0000 | 0.0000 ± 0.0000 | 2.8000 ± 2.1679 | 2346.2000 ± 439.4271 | 1.1250 | ||||
| Janus--VAE | 0.0000 ± 0.0000 | 0.0000 ± 0.0000 | 21.0000 ± 2.0000 | 10152.4000 ± 1683.2713 | 1.8750 | ||||
| 6cnode-set constrained | |||||||||
| JanusNC | 0.0001 ± 0.0000 | 0.0000 ± 0.0000 | 141.0000 ± 6.8191 | 4666.0000 ± 502.5221 | 1.7500 | ||||
| Hyperlap+ | 0.0000 ± 0.0000 | 1.0000 ± 0.0000 | 1218.8000 ± 43.8030 | 13909.2000 ± 2474.6313 | 2.6250 | ||||
| Hyperlap | 0.0000 ± 0.0000 | 0.8000 ± 0.4472 | 2865.2000 ± 49.1650 | 16890.4000 ± 2438.8031 | 2.8750 | ||||
| HyperDK11 | 0.0000 ± 0.0000 | 0.8000 ± 0.4472 | 5217.6000 ± 29.7456 | 42017.2000 ± 1479.0841 | 3.6250 | ||||
| HyperPLR | 0.0012 ± 0.0000 | 1.0000 ± 0.0000 | 829.6000 ± 5.6833 | 338960.4000 ± 5610.0259 | 4.3750 | ||||
| HyperDK00 | 0.0020 ± 0.0000 | 2.0000 ± 0.0000 | 11568.6000 ± 114.3451 | 176494.8000 ± 2118.9379 | 5.7500 | ||||
Macroscopic structure performance comparison on the contact-primary-school dataset. Methods are grouped by kind. Reported metrics: Incidence Matrix Density (lower is better), LCC Diameter (lower is better), Clique Exp. # Edges (lower is better), Line
| Model | Incidence Matrix Density | LCC Diameter | Clique Exp. # Edges | Line Graph # Edges | Avg. Rank | ||||
| 6cunconstrained | |||||||||
| Janus | 0.0000 ± 0.0000 | 0.2000 ± 0.4472 | 339.8000 ± 22.6208 | 79106.8000 ± 8182.4088 | 1.8750 | ||||
| TheRA | 0.0014 | 0.0000 | 714.0000 | 326828.0000 | 2.7500 | ||||
| HyperPA | 0.0001 ± 0.0000 | 0.2000 ± 0.4472 | 580.0000 ± 419.0692 | 1606982.2000 ± 443553.1759 | 2.8750 | ||||
| SubsetSampling | 0.0001 ± 0.0000 | 0.0000 ± 0.0000 | 829.4000 ± 474.7924 | 1985241.6000 ± 784304.1783 | 3.2500 | ||||
| NaivePA | 0.0042 ± 0.0000 | 0.0000 ± 0.0000 | 4214.4000 ± 624.7234 | 7413493.4000 ± 1293515.7968 | 4.2500 | ||||
| 6c(Janus) reconstruction upper bound | |||||||||
| JanusNC--VAE | 0.0000 ± 0.0000 | 0.0000 ± 0.0000 | 2.0000 ± 1.4142 | 6485.8000 ± 2344.5962 | 1.1250 | ||||
| Janus--VAE | 0.0000 ± 0.0000 | 0.0000 ± 0.0000 | 26.8000 ± 5.0200 | 34578.2000 ± 2824.2333 | 1.8750 | ||||
| 6cnode-set constrained | |||||||||
| JanusNC | 0.0000 ± 0.0000 | 0.0000 ± 0.0000 | 143.8000 ± 12.1943 | 11737.0000 ± 1662.6089 | 1.8750 | ||||
| Hyperlap | 0.0000 ± 0.0000 | 0.2000 ± 0.4472 | 1934.0000 ± 62.1410 | 7266.8000 ± 3264.9594 | 2.3750 | ||||
| Hyperlap+ | 0.0000 ± 0.0000 | 1.0000 ± 0.0000 | 263.4000 ± 214.5001 | 67957.6000 ± 21124.7408 | 2.8750 | ||||
| HyperPLR | 0.0010 ± 0.0000 | 0.0000 ± 0.0000 | 1455.0000 ± 0.0000 | 622811.4000 ± 31925.1994 | 3.6250 | ||||
| HyperDK11 | 0.0001 ± 0.0000 | 1.0000 ± 0.0000 | 6388.8000 ± 29.3462 | 357168.2000 ± 9569.1507 | 4.5000 | ||||
| HyperDK00 | 0.0029 ± 0.0000 | 1.0000 ± 0.0000 | 12522.0000 ± 77.9519 | 676662.8000 ± 5594.9212 | 5.7500 | ||||
Macroscopic structure performance comparison on the email-Enron dataset. Methods are grouped by kind. Reported metrics: Incidence Matrix Density (lower is better), LCC Diameter (lower is better), Clique Exp. # Edges (lower is better), Line Graph # Ed
| Model | Incidence Matrix Density | LCC Diameter | Clique Exp. # Edges | Line Graph # Edges | Avg. Rank | ||||
| 6cunconstrained | |||||||||
| Janus | 0.0021 ± 0.0003 | 0.0000 ± 0.0000 | 13.2000 ± 10.5451 | 20514.4000 ± 3063.9399 | 1.8750 | ||||
| HyperPA | 0.0018 ± 0.0010 | 0.0000 ± 0.0000 | 244.4000 ± 154.3869 | 31887.8000 ± 26026.0117 | 2.1250 | ||||
| SubsetSampling | 0.0017 ± 0.0006 | 0.2000 ± 0.4472 | 431.0000 ± 107.2357 | 41643.8000 ± 11717.4138 | 2.7500 | ||||
| TheRA | 0.0026 | 1.0000 | 1275.0000 | 14821.0000 | 3.6250 | ||||
| NaivePA | 0.0098 ± 0.0008 | 1.0000 ± 0.0000 | 1038.8000 ± 178.2939 | 112411.2000 ± 54623.5179 | 4.6250 | ||||
| 6c(Janus) reconstruction upper bound | |||||||||
| JanusNC--VAE | 0.0000 ± 0.0000 | 0.0000 ± 0.0000 | 2.0000 ± 4.4721 | 266.4000 ± 332.3316 | 1.2500 | ||||
| Janus--VAE | 0.0000 ± 0.0000 | 0.0000 ± 0.0000 | 2.0000 ± 2.1213 | 461.8000 ± 388.9758 | 1.7500 | ||||
| 6cnode-set constrained | |||||||||
| JanusNC | 0.0003 ± 0.0001 | 0.0000 ± 0.0000 | 15.0000 ± 4.6368 | 2228.2000 ± 821.6256 | 1.3750 | ||||
| Hyperlap+ | 0.0009 ± 0.0000 | 0.2000 ± 0.4472 | 686.0000 ± 35.3483 | 3603.8000 ± 1964.1286 | 3.0000 | ||||
| HyperDK11 | 0.0001 ± 0.0001 | 1.0000 ± 0.0000 | 2161.2000 ± 22.6539 | 5507.4000 ± 878.6420 | 3.6250 | ||||
| HyperPLR | 0.0020 ± 0.0002 | 0.0000 ± 0.0000 | 62.4000 ± 3.3615 | 23527.8000 ± 3819.9611 | 3.6250 | ||||
| Hyperlap | 0.0009 ± 0.0001 | 1.0000 ± 0.0000 | 1846.4000 ± 106.7183 | 2849.4000 ± 1528.9669 | 3.6250 | ||||
| HyperDK00 | 0.0020 ± 0.0001 | 2.0000 ± 0.0000 | 3064.8000 ± 28.3231 | 22566.4000 ± 422.1194 | 5.7500 | ||||
Macroscopic structure performance comparison on the email-Eu dataset. Methods are grouped by kind. Reported metrics: Incidence Matrix Density (lower is better), LCC Diameter (lower is better), Clique Exp. # Edges (lower is better), Line Graph # Edges
| Model | Incidence Matrix Density | LCC Diameter | Clique Exp. # Edges | Line Graph # Edges | Avg. Rank | ||||
| 6cunconstrained | |||||||||
| SubsetSampling | 0.0000 ± 0.0000 | 2.0000 ± 0.0000 | 28833.4000 ± 3498.3531 | 10460547.0000 ± 2901237.0644 | 2.0000 | ||||
| Janus | 0.0023 ± 0.0000 | 0.6667 ± 0.5774 | 16744.6667 ± 248.4056 | 22185259.0000 ± 258695.8816 | 2.7500 | ||||
| HyperPA | 0.0003 ± 0.0003 | 2.2000 ± 0.4472 | 10587.2000 ± 1468.2138 | 34082994.6000 ± 3768618.3128 | 2.8750 | ||||
| TheRA | 0.0013 | 4.0000 | 32109.0000 | 356438.0000 | 3.5000 | ||||
| NaivePA | 0.0010 ± 0.0000 | 2.2000 ± 0.4472 | 36980.0000 ± 1142.5067 | 30468155.6000 ± 5423212.4123 | 3.8750 | ||||
| 6c(Janus) reconstruction upper bound | |||||||||
| JanusNC--VAE | 0.0000 ± 0.0000 | 0.0000 ± 0.0000 | 57.2000 ± 19.1233 | 123360.2000 ± 18285.6379 | 1.1250 | ||||
| Janus--VAE | 0.0001 ± 0.0000 | 0.0000 ± 0.0000 | 755.0000 ± 69.9393 | 700513.2000 ± 31178.1844 | 1.8750 | ||||
| 6cnode-set constrained | |||||||||
| HyperPLR | 0.0002 ± 0.0000 | 0.2000 ± 0.4472 | 13615.0000 ± 88.9326 | 1239056.4000 ± 243479.8529 | 2.2500 | ||||
| Hyperlap+ | 0.0004 ± 0.0000 | 0.8000 ± 0.4472 | 20184.4000 ± 306.8897 | 165310.4000 ± 28866.5000 | 3.0000 | ||||
| HyperDK11 | 0.0001 ± 0.0000 | 2.0000 ± 0.0000 | 69432.0000 ± 284.6621 | 470975.4000 ± 31351.5873 | 3.1250 | ||||
| JanusNC | 0.0009 ± 0.0000 | 0.4000 ± 0.5477 | 2618.0000 ± 155.0048 | 3887615.2000 ± 94701.3252 | 3.5000 | ||||
| Hyperlap | 0.0004 ± 0.0000 | 2.0000 ± 0.0000 | 57953.8000 ± 1494.2255 | 769716.6000 ± 85962.1059 | 3.8750 | ||||
| HyperDK00 | 0.0003 ± 0.0000 | 4.0000 ± 0.0000 | 97434.4000 ± 438.4140 | 4874286.4000 ± 3305.5184 | 5.2500 | ||||
HyperTrans and Overlapness performance comparison on the contact-high-school dataset. Methods are grouped by kind. Reported metrics: HyperTrans (lower is better), Global Overlapness (lower is better), Egonet Overlapness (lower is better). Colored cel
| Model | HyperTrans | Global Overlapness | Egonet Overlapness | Avg. Rank | |||||
| 5cunconstrained | |||||||||
| Janus | 0.0280 ± 0.0027 | 0.2615 ± 0.0763 | 0.1879 ± 0.0152 | 1.3333 | |||||
| HyperPA | 0.2821 ± 0.0056 | 2.0974 ± 1.8201 | 0.9480 ± 0.0328 | 3.0000 | |||||
| TheRA | 0.0014 | 6.7492 | 2.0610 | 3.0000 | |||||
| SubsetSampling | 0.1073 ± 0.0134 | 8.0551 ± 1.1319 | 1.3749 ± 0.0112 | 3.6667 | |||||
| NaivePA | 0.2527 ± 0.0038 | 19.8167 ± 2.7867 | 1.1368 ± 0.0524 | 4.0000 | |||||
| 5c(Janus) reconstruction upper bound | |||||||||
| JanusNC--VAE | 0.0005 ± 0.0001 | 0.1058 ± 0.0195 | 0.0061 ± 0.0018 | 1.0000 | |||||
| Janus--VAE | 0.0023 ± 0.0004 | 0.4606 ± 0.0672 | 0.0282 ± 0.0060 | 2.0000 | |||||
| 5cnode-set constrained | |||||||||
| Hyperlap+ | 0.0249 ± 0.0015 | 0.0000 ± 0.0000 | 0.6173 ± 0.0178 | 1.6667 | |||||
| JanusNC | 0.0075 ± 0.0010 | 0.5020 ± 0.0918 | 0.0302 ± 0.0040 | 1.6667 | |||||
| Hyperlap | 0.1665 ± 0.0018 | 0.0683 ± 0.0935 | 1.1299 ± 0.0128 | 2.6667 | |||||
| HyperDK11 | 0.2352 ± 0.0010 | 2.5694 ± 0.0745 | 1.6703 ± 0.0046 | 4.6667 | |||||
| HyperPLR | 0.2109 ± 0.0029 | 9.3780 ± 0.0729 | 1.6658 ± 0.0168 | 4.6667 | |||||
| HyperDK00 | 0.3173 ± 0.0007 | 4.8538 ± 0.1029 | 1.8636 ± 0.0063 | 5.6667 | |||||
HyperTrans and Overlapness performance comparison on the contact-primary-school dataset. Methods are grouped by kind. Reported metrics: HyperTrans (lower is better), Global Overlapness (lower is better), Egonet Overlapness (lower is better). Colored
| Model | HyperTrans | Global Overlapness | Egonet Overlapness | Avg. Rank | |||||
| 5cunconstrained | |||||||||
| Janus | 0.0136 ± 0.0023 | 0.3316 ± 0.1783 | 0.1265 ± 0.0211 | 1.3333 | |||||
| HyperPA | 0.1999 ± 0.0038 | 10.1188 ± 6.1790 | 1.0053 ± 0.0948 | 3.0000 | |||||
| TheRA | 0.0024 | 18.2727 | 2.7430 | 3.0000 | |||||
| SubsetSampling | 0.0202 ± 0.0050 | 22.2888 ± 7.6265 | 1.4931 ± 0.0780 | 3.6667 | |||||
| NaivePA | 0.2036 ± 0.0085 | 34.7454 ± 8.3622 | 0.5792 ± 0.1201 | 4.0000 | |||||
| 5c(Janus) reconstruction upper bound | |||||||||
| JanusNC--VAE | 0.0002 ± 0.0001 | 0.1810 ± 0.0486 | 0.0064 ± 0.0011 | 1.0000 | |||||
| Janus--VAE | 0.0018 ± 0.0002 | 1.0091 ± 0.0713 | 0.0346 ± 0.0049 | 2.0000 | |||||
| 5cnode-set constrained | |||||||||
| JanusNC | 0.0091 ± 0.0006 | 0.5702 ± 0.0316 | 0.0537 ± 0.0070 | 1.6667 | |||||
| Hyperlap+ | 0.0119 ± 0.0088 | 0.0000 ± 0.0000 | 0.1621 ± 0.1541 | 1.8333 | |||||
| Hyperlap | 0.0558 ± 0.0019 | 0.0000 ± 0.0000 | 0.9482 ± 0.0193 | 2.5000 | |||||
| HyperDK11 | 0.1293 ± 0.0012 | 10.7215 ± 0.2688 | 2.1957 ± 0.0035 | 4.6667 | |||||
| HyperPLR | 0.1316 ± 0.0019 | 12.6132 ± 0.2169 | 1.9294 ± 0.0252 | 5.0000 | |||||
| HyperDK00 | 0.2671 ± 0.0006 | 12.5322 ± 0.1986 | 2.1645 ± 0.0062 | 5.3333 | |||||
Macroscopic size performance comparison on the NDC-classes dataset. Methods are grouped by kind. Reported metrics: # Nodes (lower is better), # Hyperedges (lower is better), LCC # Nodes (lower is better), LCC # Hyperedges (lower is better). Colored c
| Model | # Nodes | # Hyperedges | LCC # Nodes | LCC # Hyperedges | Avg. Rank | ||||
| 6cunconstrained | |||||||||
| Janus | 442.2000 ± 20.4377 | 0.0000 ± 0.0000 | 20.8000 ± 10.3296 | 193.2000 ± 9.8336 | 1.2500 | ||||
| SubsetSampling | 554.4000 ± 21.1258 | 83.0000 ± 46.5403 | 26.2000 ± 21.8792 | 229.8000 ± 95.3950 | 2.7500 | ||||
| TheRA | 12.0000 | 60.0000 | 495.0000 | 306.0000 | 3.2500 | ||||
| NaivePA | 560.4000 ± 17.7285 | 82.6000 ± 24.6840 | 27.4000 ± 17.7285 | 249.4000 ± 92.1916 | 3.5000 | ||||
| HyperPA | 568.2000 ± 18.9526 | 92.8000 ± 67.9389 | 50.4000 ± 15.5338 | 246.8000 ± 118.1194 | 4.2500 | ||||
| 6c(Janus) reconstruction upper bound | |||||||||
| JanusNC--VAE | 0.0000 ± 0.0000 | 4.2000 ± 2.3875 | 2.0000 ± 3.9370 | 5.0000 ± 4.0620 | 1.1250 | ||||
| Janus--VAE | 0.0000 ± 0.0000 | 25.0000 ± 4.8477 | 35.2000 ± 39.2326 | 37.4000 ± 20.0823 | 1.8750 | ||||
| 6cnode-set constrained | |||||||||
| JanusNC | 139.4000 ± 3.5071 | 0.0000 ± 0.0000 | 20.0000 ± 4.3589 | 51.8000 ± 3.4928 | 1.8750 | ||||
| HyperPLR | 261.4000 ± 11.0136 | 0.0000 ± 0.0000 | 19.4000 ± 2.0736 | 126.0000 ± 10.3682 | 2.6250 | ||||
| HyperDK11 | 0.0000 ± 0.0000 | 10.6000 ± 2.7019 | 527.6000 ± 3.5777 | 256.8000 ± 3.7014 | 3.8750 | ||||
| HyperDK00 | 5.4000 ± 3.3615 | 2.0000 ± 1.5811 | 527.6000 ± 3.3615 | 270.0000 ± 1.5811 | 4.1250 | ||||
| Hyperlap | 198.0000 ± 13.2853 | 39.0000 ± 0.0000 | 335.0000 ± 13.2853 | 233.0000 ± 0.0000 | 4.2500 | ||||
| Hyperlap+ | 205.2000 ± 7.1903 | 39.0000 ± 0.0000 | 327.8000 ± 7.1903 | 233.0000 ± 0.0000 | 4.2500 | ||||
Macroscopic size performance comparison on the contact-high-school dataset. Methods are grouped by kind. Reported metrics: # Nodes (lower is better), # Hyperedges (lower is better), LCC # Nodes (lower is better), LCC # Hyperedges (lower is better). C
| Model | # Nodes | # Hyperedges | LCC # Nodes | LCC # Hyperedges | Avg. Rank | ||||
| 6cunconstrained | |||||||||
| TheRA | 0.0000 | 0.0000 | 0.0000 | 0.0000 | 1.1250 | ||||
| Janus | 0.2000 ± 0.4472 | 0.0000 ± 0.0000 | 1.0000 ± 1.0000 | 0.8000 ± 0.8367 | 1.8750 | ||||
| HyperPA | 8.2000 ± 3.7683 | 342.4000 ± 309.4217 | 8.2000 ± 3.7683 | 342.4000 ± 309.4217 | 4.0000 | ||||
| NaivePA | 6.8000 ± 2.6833 | 554.6000 ± 259.1135 | 6.8000 ± 2.6833 | 554.6000 ± 259.1135 | 4.0000 | ||||
| SubsetSampling | 4.4000 ± 1.8166 | 1241.8000 ± 118.7800 | 4.4000 ± 1.8166 | 1241.8000 ± 118.7800 | 4.0000 | ||||
| 6c(Janus) reconstruction upper bound | |||||||||
| JanusNC--VAE | 0.0000 ± 0.0000 | 16.0000 ± 3.0822 | 0.0000 ± 0.0000 | 16.0000 ± 3.0822 | 1.2500 | ||||
| Janus--VAE | 0.0000 ± 0.0000 | 46.8000 ± 4.4944 | 0.0000 ± 0.0000 | 46.8000 ± 4.4944 | 1.7500 | ||||
| 6cnode-set constrained | |||||||||
| Hyperlap+ | 0.0000 ± 0.0000 | 0.0000 ± 0.0000 | 0.0000 ± 0.0000 | 0.0000 ± 0.0000 | 2.2500 | ||||
| JanusNC | 0.2000 ± 0.4472 | 0.0000 ± 0.0000 | 0.2000 ± 0.4472 | 0.0000 ± 0.0000 | 3.2500 | ||||
| HyperDK11 | 0.0000 ± 0.0000 | 395.4000 ± 11.0589 | 0.0000 ± 0.0000 | 395.4000 ± 11.0589 | 3.5000 | ||||
| Hyperlap | 0.4000 ± 0.5477 | 0.0000 ± 0.0000 | 0.4000 ± 0.5477 | 0.0000 ± 0.0000 | 3.7500 | ||||
| HyperDK00 | 0.0000 ± 0.0000 | 2257.6000 ± 37.7995 | 0.0000 ± 0.0000 | 2257.6000 ± 37.7995 | 4.0000 | ||||
| HyperPLR | 2.0000 ± 0.0000 | 0.0000 ± 0.0000 | 2.0000 ± 0.0000 | 0.0000 ± 0.0000 | 4.2500 | ||||
Macroscopic size performance comparison on the contact-primary-school dataset. Methods are grouped by kind. Reported metrics: # Nodes (lower is better), # Hyperedges (lower is better), LCC # Nodes (lower is better), LCC # Hyperedges (lower is better)
| Model | # Nodes | # Hyperedges | LCC # Nodes | LCC # Hyperedges | Avg. Rank | ||||
| 6cunconstrained | |||||||||
| TheRA | 0.0000 | 0.0000 | 0.0000 | 0.0000 | 1.2500 | ||||
| Janus | 0.2000 ± 0.4472 | 0.0000 ± 0.0000 | 0.2000 ± 0.4472 | 0.0000 ± 0.0000 | 1.7500 | ||||
| HyperPA | 1.8000 ± 0.8367 | 1033.0000 ± 694.5265 | 1.8000 ± 0.8367 | 1033.0000 ± 694.5265 | 3.5000 | ||||
| NaivePA | 1.4000 ± 0.8944 | 1314.0000 ± 586.8893 | 1.4000 ± 0.8944 | 1314.0000 ± 586.8893 | 3.5000 | ||||
| SubsetSampling | 2.6000 ± 1.3416 | 2360.6000 ± 758.3576 | 2.6000 ± 1.3416 | 2360.6000 ± 758.3576 | 5.0000 | ||||
| 6c(Janus) reconstruction upper bound | |||||||||
| JanusNC--VAE | 0.0000 ± 0.0000 | 18.4000 ± 5.3666 | 0.0000 ± 0.0000 | 18.4000 ± 5.3666 | 1.2500 | ||||
| Janus--VAE | 0.0000 ± 0.0000 | 80.0000 ± 5.8737 | 0.0000 ± 0.0000 | 80.0000 ± 5.8737 | 1.7500 | ||||
| 6cnode-set constrained | |||||||||
| Hyperlap | 0.0000 ± 0.0000 | 0.0000 ± 0.0000 | 0.0000 ± 0.0000 | 0.0000 ± 0.0000 | 2.7500 | ||||
| Hyperlap+ | 0.0000 ± 0.0000 | 0.0000 ± 0.0000 | 0.0000 ± 0.0000 | 0.0000 ± 0.0000 | 2.7500 | ||||
| JanusNC | 0.0000 ± 0.0000 | 0.0000 ± 0.0000 | 0.0000 ± 0.0000 | 0.0000 ± 0.0000 | 2.7500 | ||||
| HyperDK11 | 0.0000 ± 0.0000 | 1241.8000 ± 32.8283 | 0.0000 ± 0.0000 | 1241.8000 ± 32.8283 | 4.0000 | ||||
| HyperPLR | 1.0000 ± 0.0000 | 0.0000 ± 0.0000 | 1.0000 ± 0.0000 | 0.0000 ± 0.0000 | 4.2500 | ||||
| HyperDK00 | 0.0000 ± 0.0000 | 3809.2000 ± 31.6259 | 0.0000 ± 0.0000 | 3809.2000 ± 31.6259 | 4.5000 | ||||
Macroscopic size performance comparison on the email-Enron dataset. Methods are grouped by kind. Reported metrics: # Nodes (lower is better), # Hyperedges (lower is better), LCC # Nodes (lower is better), LCC # Hyperedges (lower is better). Colored c
| Model | # Nodes | # Hyperedges | LCC # Nodes | LCC # Hyperedges | Avg. Rank | ||||
| 6cunconstrained | |||||||||
| Janus | 0.0000 ± 0.0000 | 0.0000 ± 0.0000 | 0.0000 ± 0.0000 | 0.0000 ± 0.0000 | 1.2500 | ||||
| TheRA | 0.0000 | 53.0000 | 0.0000 | 53.0000 | 1.7500 | ||||
| HyperPA | 13.0000 ± 3.3912 | 253.0000 ± 116.8696 | 13.6000 ± 2.8810 | 253.6000 ± 116.1671 | 3.7500 | ||||
| SubsetSampling | 8.8000 ± 2.1679 | 380.6000 ± 72.6726 | 9.0000 ± 2.2361 | 380.8000 ± 72.6684 | 4.0000 | ||||
| NaivePA | 13.2000 ± 2.1679 | 316.0000 ± 114.5949 | 13.2000 ± 2.1679 | 316.0000 ± 114.5949 | 4.2500 | ||||
| 6c(Janus) reconstruction upper bound | |||||||||
| JanusNC--VAE | 0.0000 ± 0.0000 | 1.0000 ± 1.2247 | 0.0000 ± 0.0000 | 1.0000 ± 1.2247 | 1.2500 | ||||
| Janus--VAE | 0.0000 ± 0.0000 | 3.0000 ± 2.0000 | 0.0000 ± 0.0000 | 3.0000 ± 2.0000 | 1.7500 | ||||
| 6cnode-set constrained | |||||||||
| Hyperlap+ | 0.0000 ± 0.0000 | 53.0000 ± 0.0000 | 0.0000 ± 0.0000 | 53.0000 ± 0.0000 | 2.7500 | ||||
| JanusNC | 0.6000 ± 0.5477 | 0.0000 ± 0.0000 | 0.6000 ± 0.5477 | 0.0000 ± 0.0000 | 3.2500 | ||||
| HyperDK11 | 0.0000 ± 0.0000 | 82.6000 ± 8.2946 | 0.0000 ± 0.0000 | 82.6000 ± 8.2946 | 3.5000 | ||||
| HyperPLR | 2.0000 ± 0.0000 | 0.0000 ± 0.0000 | 2.0000 ± 0.0000 | 0.0000 ± 0.0000 | 3.7500 | ||||
| Hyperlap | 0.4000 ± 0.5477 | 53.0000 ± 0.0000 | 0.4000 ± 0.5477 | 53.0000 ± 0.0000 | 3.7500 | ||||
| HyperDK00 | 0.0000 ± 0.0000 | 183.6000 ± 11.3490 | 0.0000 ± 0.0000 | 183.6000 ± 11.3490 | 4.0000 | ||||
Macroscopic size performance comparison on the email-Eu dataset. Methods are grouped by kind. Reported metrics: # Nodes (lower is better), # Hyperedges (lower is better), LCC # Nodes (lower is better), LCC # Hyperedges (lower is better). Colored cell
| Model | # Nodes | # Hyperedges | LCC # Nodes | LCC # Hyperedges | Avg. Rank | ||||
| 6cunconstrained | |||||||||
| Janus | 12.3333 ± 7.0238 | 0.0000 ± 0.0000 | 6.3333 ± 6.5064 | 10.0000 ± 3.6056 | 1.7500 | ||||
| TheRA | 12.0000 | 507.0000 | 7.0000 | 488.0000 | 2.2500 | ||||
| SubsetSampling | 3.6000 ± 1.3416 | 1356.8000 ± 823.6171 | 14.6000 ± 2.0736 | 1338.6000 ± 823.6785 | 2.5000 | ||||
| NaivePA | 3.8000 ± 2.0494 | 1656.0000 ± 527.4263 | 15.2000 ± 2.0494 | 1637.0000 ± 527.4263 | 3.5000 | ||||
| HyperPA | 80.8000 ± 79.2950 | 2039.4000 ± 1234.3607 | 71.8000 ± 69.7044 | 2022.4000 ± 1233.1870 | 5.0000 | ||||
| 6c(Janus) reconstruction upper bound | |||||||||
| JanusNC--VAE | 0.2000 ± 0.4472 | 89.4000 ± 10.8995 | 0.0000 ± 0.0000 | 89.6000 ± 10.9453 | 1.2500 | ||||
| Janus--VAE | 0.0000 ± 0.0000 | 492.6000 ± 20.5256 | 0.4000 ± 0.5477 | 493.0000 ± 20.5791 | 1.7500 | ||||
| 6cnode-set constrained | |||||||||
| JanusNC | 47.8000 ± 4.0249 | 0.0000 ± 0.0000 | 35.8000 ± 5.4037 | 12.0000 ± 2.9155 | 2.8750 | ||||
| HyperDK11 | 0.0000 ± 0.0000 | 1378.4000 ± 43.1080 | 18.2000 ± 0.4472 | 1360.2000 ± 42.8567 | 3.1250 | ||||
| Hyperlap | 46.8000 ± 4.6043 | 507.0000 ± 0.0000 | 27.8000 ± 4.6043 | 488.0000 ± 0.0000 | 3.2500 | ||||
| HyperDK00 | 0.0000 ± 0.0000 | 2712.4000 ± 93.5217 | 19.0000 ± 0.0000 | 2693.4000 ± 93.5217 | 3.8750 | ||||
| HyperPLR | 137.4000 ± 1.5166 | 0.0000 ± 0.0000 | 118.4000 ± 1.5166 | 19.0000 ± 0.0000 | 3.8750 | ||||
| Hyperlap+ | 49.8000 ± 4.5497 | 507.0000 ± 0.0000 | 30.8000 ± 4.5497 | 488.0000 ± 0.0000 | 4.0000 | ||||
Higher-order dissimilarity measures performance comparison on the NDC-classes dataset. Methods are grouped by kind. Reported metrics: Hyper NetSimile (lower is better), Hyperedge Portrait Divergence (lower is better). Colored cells mark the top three
| Model | Hyper NetSimile | Hyperedge Portrait Divergence | Avg. Rank | ||||||
| 4cunconstrained | |||||||||
| Janus | 6.0414 ± 0.3021 | 0.4210 ± 0.0484 | 1.5000 | ||||||
| TheRA | 9.7695 | 0.3320 | 2.0000 | ||||||
| HyperPA | 8.0762 ± 0.4667 | 0.6145 ± 0.0348 | 3.0000 | ||||||
| SubsetSampling | 9.8929 ± 0.4720 | 0.5203 ± 0.0553 | 3.5000 | ||||||
| NaivePA | 10.2800 ± 0.3795 | 0.7330 ± 0.0039 | 5.0000 | ||||||
| 4c(Janus) reconstruction upper bound | |||||||||
| JanusNC--VAE | 0.4208 ± 0.5567 | 0.0217 ± 0.0295 | 1.0000 | ||||||
| Janus--VAE | 1.1361 ± 0.0679 | 0.0561 ± 0.0299 | 2.0000 | ||||||
| 4cnode-set constrained | |||||||||
| JanusNC | 2.5608 ± 0.0646 | 0.1518 ± 0.0259 | 1.0000 | ||||||
| HyperPLR | 3.3487 ± 0.1112 | 0.2818 ± 0.0394 | 2.0000 | ||||||
| HyperDK11 | 8.5485 ± 0.0541 | 0.6143 ± 0.0151 | 3.5000 | ||||||
| Hyperlap+ | 8.4143 ± 0.3084 | 0.6148 ± 0.0223 | 3.5000 | ||||||
| Hyperlap | 9.8272 ± 0.0645 | 0.6455 ± 0.0306 | 5.0000 | ||||||
| HyperDK00 | 10.2463 ± 0.0391 | 0.7673 ± 0.0258 | 6.0000 | ||||||
Higher-order dissimilarity measures performance comparison on the contact-high-school dataset. Methods are grouped by kind. Reported metrics: Hyper NetSimile (lower is better), Hyperedge Portrait Divergence (lower is better). Colored cells mark the t
| Model | Hyper NetSimile | Hyperedge Portrait Divergence | Avg. Rank | ||||||
| 4cunconstrained | |||||||||
| Janus | 0.9456 ± 0.1792 | 0.3405 ± 0.0034 | 1.5000 | ||||||
| TheRA | 2.8572 | 0.3232 | 1.5000 | ||||||
| HyperPA | 5.2400 ± 0.0917 | 0.6133 ± 0.0137 | 3.0000 | ||||||
| SubsetSampling | 6.4425 ± 0.1279 | 0.8202 ± 0.0198 | 4.0000 | ||||||
| NaivePA | 6.5915 ± 0.1751 | 0.8949 ± 0.0011 | 5.0000 | ||||||
| 4c(Janus) reconstruction upper bound | |||||||||
| JanusNC--VAE | 0.0130 ± 0.0040 | 0.0738 ± 0.0165 | 1.0000 | ||||||
| Janus--VAE | 0.0720 ± 0.0199 | 0.1026 ± 0.0067 | 2.0000 | ||||||
| 4cnode-set constrained | |||||||||
| JanusNC | 0.1946 ± 0.0177 | 0.2280 ± 0.0329 | 1.0000 | ||||||
| Hyperlap | 2.9377 ± 0.0784 | 0.3532 ± 0.0045 | 2.5000 | ||||||
| HyperPLR | 2.0690 ± 0.0146 | 0.7258 ± 0.0012 | 3.5000 | ||||||
| Hyperlap+ | 3.0168 ± 0.0883 | 0.5113 ± 0.0209 | 3.5000 | ||||||
| HyperDK11 | 3.3553 ± 0.0422 | 0.5258 ± 0.0135 | 4.5000 | ||||||
| HyperDK00 | 6.0711 ± 0.0307 | 0.8222 ± 0.0048 | 6.0000 | ||||||
Higher-order dissimilarity measures performance comparison on the contact-primary-school dataset. Methods are grouped by kind. Reported metrics: Hyper NetSimile (lower is better), Hyperedge Portrait Divergence (lower is better). Colored cells mark th
| Model | Hyper NetSimile | Hyperedge Portrait Divergence | Avg. Rank | ||||||
| 4cunconstrained | |||||||||
| Janus | 0.3685 ± 0.0322 | 0.2277 ± 0.0043 | 1.0000 | ||||||
| HyperPA | 4.0878 ± 0.1772 | 0.5031 ± 0.0319 | 2.5000 | ||||||
| TheRA | 2.0996 | 0.5405 | 2.5000 | ||||||
| NaivePA | 5.2683 ± 0.1044 | 0.8612 ± 0.0009 | 4.5000 | ||||||
| SubsetSampling | 5.8668 ± 0.0935 | 0.8108 ± 0.0121 | 4.5000 | ||||||
| 4c(Janus) reconstruction upper bound | |||||||||
| JanusNC--VAE | 0.0128 ± 0.0028 | 0.0876 ± 0.0176 | 1.0000 | ||||||
| Janus--VAE | 0.0661 ± 0.0144 | 0.1326 ± 0.0081 | 2.0000 | ||||||
| 4cnode-set constrained | |||||||||
| JanusNC | 0.1764 ± 0.0171 | 0.2020 ± 0.0031 | 1.0000 | ||||||
| Hyperlap | 2.1658 ± 0.0354 | 0.2114 ± 0.0031 | 2.5000 | ||||||
| HyperPLR | 1.6567 ± 0.0515 | 0.5826 ± 0.0023 | 3.5000 | ||||||
| HyperDK11 | 3.5480 ± 0.0880 | 0.4578 ± 0.0046 | 4.0000 | ||||||
| Hyperlap+ | 2.9876 ± 0.0155 | 0.5179 ± 0.0087 | 4.0000 | ||||||
| HyperDK00 | 7.6628 ± 0.0568 | 0.8482 ± 0.0071 | 6.0000 | ||||||
Higher-order dissimilarity measures performance comparison on the email-Enron dataset. Methods are grouped by kind. Reported metrics: Hyper NetSimile (lower is better), Hyperedge Portrait Divergence (lower is better). Colored cells mark the top three
| Model | Hyper NetSimile | Hyperedge Portrait Divergence | Avg. Rank | ||||||
| 4cunconstrained | |||||||||
| Janus | 0.8984 ± 0.0678 | 0.1158 ± 0.0086 | 1.0000 | ||||||
| HyperPA | 3.8839 ± 0.2596 | 0.2858 ± 0.0575 | 3.0000 | ||||||
| TheRA | 3.5654 | 0.5158 | 3.0000 | ||||||
| NaivePA | 3.8490 ± 0.4478 | 0.6531 ± 0.0097 | 4.0000 | ||||||
| SubsetSampling | 4.1982 ± 0.1851 | 0.4526 ± 0.0382 | 4.0000 | ||||||
| 4c(Janus) reconstruction upper bound | |||||||||
| JanusNC--VAE | 0.0125 ± 0.0216 | 0.0029 ± 0.0046 | 1.0000 | ||||||
| Janus--VAE | 0.0263 ± 0.0239 | 0.0073 ± 0.0063 | 2.0000 | ||||||
| 4cnode-set constrained | |||||||||
| JanusNC | 0.1391 ± 0.0181 | 0.0461 ± 0.0031 | 1.0000 | ||||||
| HyperPLR | 0.6153 ± 0.0898 | 0.2680 ± 0.0090 | 2.0000 | ||||||
| HyperDK11 | 3.2826 ± 0.1244 | 0.4482 ± 0.0370 | 3.0000 | ||||||
| Hyperlap+ | 3.5464 ± 0.3430 | 0.5310 ± 0.0259 | 4.0000 | ||||||
| Hyperlap | 3.7188 ± 0.1171 | 0.5543 ± 0.0277 | 5.0000 | ||||||
| HyperDK00 | 6.7569 ± 0.0927 | 0.7562 ± 0.0263 | 6.0000 | ||||||
Higher-order dissimilarity measures performance comparison on the email-Eu dataset. Methods are grouped by kind. Reported metrics: Hyper NetSimile (lower is better), Hyperedge Portrait Divergence (lower is better). Colored cells mark the top three va
| Model | Hyper NetSimile | Hyperedge Portrait Divergence | Avg. Rank | ||||||
| 4cunconstrained | |||||||||
| Janus | 4.1857 ± 0.0573 | 0.4227 ± 0.0470 | 1.0000 | ||||||
| SubsetSampling | 4.6115 ± 0.3025 | 0.4287 ± 0.0390 | 2.0000 | ||||||
| TheRA | 6.1181 | 0.7134 | 3.5000 | ||||||
| HyperPA | 7.9956 ± 0.2381 | 0.5949 ± 0.0143 | 4.0000 | ||||||
| NaivePA | 6.2691 ± 0.2019 | 0.7350 ± 0.0033 | 4.5000 | ||||||
| 4c(Janus) reconstruction upper bound | |||||||||
| JanusNC--VAE | 0.0387 ± 0.0078 | 0.0574 ± 0.0341 | 1.0000 | ||||||
| Janus--VAE | 0.3138 ± 0.0268 | 0.1125 ± 0.0023 | 2.0000 | ||||||
| 4cnode-set constrained | |||||||||
| JanusNC | 1.2224 ± 0.0476 | 0.3009 ± 0.0305 | 1.0000 | ||||||
| HyperDK11 | 4.4075 ± 0.0247 | 0.4309 ± 0.0036 | 2.0000 | ||||||
| Hyperlap | 4.6837 ± 0.1403 | 0.5742 ± 0.0388 | 3.0000 | ||||||
| Hyperlap+ | 4.7418 ± 0.0824 | 0.6210 ± 0.0114 | 4.0000 | ||||||
| HyperPLR | 4.8988 ± 0.0219 | 0.7806 ± 0.0097 | 5.0000 | ||||||
| HyperDK00 | 9.8383 ± 0.0197 | 0.8432 ± 0.0032 | 6.0000 | ||||||
Reconstruction performance comparison on the NDC-classes dataset. Methods are grouped by kind. Reported metrics: Intersection (higher is better), Jaccard Coefficient (higher is better). Colored cells mark the top three values within each kind for ran
| Model | Intersection | Jaccard Coefficient | Avg. Rank | ||||||
| 4c(Janus) reconstruction upper bound | |||||||||
| JanusNC--VAE | 1088.0000 ± 0.0000 | 0.9962 ± 0.0022 | 1.0000 | ||||||
| Janus--VAE | 1087.6000 ± 0.5477 | 0.9768 ± 0.0035 | 2.0000 | ||||||
| 4cnode-set constrained | |||||||||
| JanusNC | 971.8000 ± 4.9193 | 0.8070 ± 0.0074 | 1.0000 | ||||||
| HyperPLR | 348.4000 ± 10.0648 | 0.1907 ± 0.0065 | 2.0000 | ||||||
| HyperDK11 | 6.4000 ± 1.8166 | 0.0030 ± 0.0008 | 3.0000 | ||||||
| Hyperlap+ | 5.0000 ± 2.3452 | 0.0024 ± 0.0011 | 4.0000 | ||||||
| Hyperlap | 3.4000 ± 1.3416 | 0.0016 ± 0.0006 | 5.0000 | ||||||
| HyperDK00 | 2.2000 ± 0.8367 | 0.0010 ± 0.0004 | 6.0000 | ||||||
Reconstruction performance comparison on the contact-high-school dataset. Methods are grouped by kind. Reported metrics: Intersection (higher is better), Jaccard Coefficient (higher is better). Colored cells mark the top three values within each kind
| Model | Intersection | Jaccard Coefficient | Avg. Rank | ||||||
| 4c(Janus) reconstruction upper bound | |||||||||
| JanusNC--VAE | 7818.0000 ± 0.0000 | 0.9980 ± 0.0004 | 1.2500 | ||||||
| Janus--VAE | 7818.0000 ± 0.0000 | 0.9940 ± 0.0006 | 1.7500 | ||||||
| 4cnode-set constrained | |||||||||
| JanusNC | 7616.8000 ± 7.3280 | 0.9498 ± 0.0018 | 1.0000 | ||||||
| HyperPLR | 2765.8000 ± 31.6654 | 0.2149 ± 0.0030 | 2.0000 | ||||||
| HyperDK11 | 574.8000 ± 31.0596 | 0.0392 ± 0.0022 | 3.0000 | ||||||
| Hyperlap | 494.6000 ± 24.0687 | 0.0352 ± 0.0018 | 4.0000 | ||||||
| Hyperlap+ | 463.4000 ± 34.1877 | 0.0338 ± 0.0026 | 5.0000 | ||||||
| HyperDK00 | 225.0000 ± 9.8742 | 0.0171 ± 0.0007 | 6.0000 | ||||||
Reconstruction performance comparison on the contact-primary-school dataset. Methods are grouped by kind. Reported metrics: Intersection (higher is better), Jaccard Coefficient (higher is better). Colored cells mark the top three values within each k
| Model | Intersection | Jaccard Coefficient | Avg. Rank | ||||||
| 4c(Janus) reconstruction upper bound | |||||||||
| JanusNC--VAE | 12704.0000 ± 0.0000 | 0.9986 ± 0.0004 | 1.2500 | ||||||
| Janus--VAE | 12704.0000 ± 0.0000 | 0.9937 ± 0.0005 | 1.7500 | ||||||
| 4cnode-set constrained | |||||||||
| JanusNC | 12243.2000 ± 20.8014 | 0.9300 ± 0.0030 | 1.0000 | ||||||
| HyperPLR | 5127.0000 ± 50.2643 | 0.2528 ± 0.0031 | 2.0000 | ||||||
| HyperDK11 | 1780.8000 ± 81.0876 | 0.0796 ± 0.0039 | 3.0000 | ||||||
| Hyperlap | 1390.0000 ± 21.7141 | 0.0657 ± 0.0011 | 4.0000 | ||||||
| Hyperlap+ | 1227.2000 ± 69.4421 | 0.0608 ± 0.0035 | 5.0000 | ||||||
| HyperDK00 | 857.4000 ± 14.3108 | 0.0413 ± 0.0007 | 6.0000 | ||||||
Reconstruction performance comparison on the email-Enron dataset. Methods are grouped by kind. Reported metrics: Intersection (higher is better), Jaccard Coefficient (higher is better). Colored cells mark the top three values within each kind for ran
| Model | Intersection | Jaccard Coefficient | Avg. Rank | ||||||
| 4c(Janus) reconstruction upper bound | |||||||||
| JanusNC--VAE | 1512.0000 ± 0.0000 | 0.9993 ± 0.0008 | 1.2500 | ||||||
| Janus--VAE | 1512.0000 ± 0.0000 | 0.9980 ± 0.0013 | 1.7500 | ||||||
| 4cnode-set constrained | |||||||||
| JanusNC | 1450.2000 ± 4.8683 | 0.9215 ± 0.0060 | 1.0000 | ||||||
| HyperPLR | 419.8000 ± 19.0316 | 0.1613 ± 0.0085 | 2.0000 | ||||||
| HyperDK11 | 82.2000 ± 5.0695 | 0.0287 ± 0.0018 | 3.0000 | ||||||
| HyperDK00 | 74.8000 ± 5.9330 | 0.0270 ± 0.0022 | 4.0000 | ||||||
| Hyperlap | 53.2000 ± 6.0581 | 0.0194 ± 0.0023 | 5.0000 | ||||||
| Hyperlap+ | 47.8000 ± 7.9812 | 0.0178 ± 0.0030 | 6.0000 | ||||||
Reconstruction performance comparison on the email-Eu dataset. Methods are grouped by kind. Reported metrics: Intersection (higher is better), Jaccard Coefficient (higher is better). Colored cells mark the top three values within each kind for ranked
| Model | Intersection | Jaccard Coefficient | Avg. Rank | ||||||
| 4c(Janus) reconstruction upper bound | |||||||||
| JanusNC--VAE | 25005.0000 ± 3.6742 | 0.9947 ± 0.0003 | 1.0000 | ||||||
| Janus--VAE | 24983.6000 ± 2.0736 | 0.9773 ± 0.0008 | 2.0000 | ||||||
| 4cnode-set constrained | |||||||||
| JanusNC | 14693.4000 ± 38.7595 | 0.4155 ± 0.0016 | 1.0000 | ||||||
| HyperPLR | 3297.2000 ± 85.4939 | 0.0705 ± 0.0020 | 2.0000 | ||||||
| HyperDK11 | 1022.4000 ± 66.8566 | 0.0215 ± 0.0014 | 3.0000 | ||||||
| HyperDK00 | 715.6000 ± 11.7175 | 0.0153 ± 0.0002 | 4.0000 | ||||||
| Hyperlap | 652.2000 ± 40.7087 | 0.0140 ± 0.0009 | 5.0000 | ||||||
| Hyperlap+ | 572.6000 ± 17.5585 | 0.0127 ± 0.0004 | 6.0000 | ||||||
Comparison results using the DGMH evaluation framework on NDC-classes and email-Eu datasets.

| Dataset | Metric | Motif | Real | JanusNC | DGMH | Best | |||
| 4*Clust. coeff. | |||||||||
| Node | 0.49 | 0.52 | 0.31 | JanusNC | 0.03 | ||||
| Edge | 0.56 | 0.66 | 0.69 | JanusNC | 0.10 | ||||
| Triangle | 0.82 | 0.80 | 0.83 | DGMH | 0.01 | ||||
| 4-clique | 0.89 | 0.86 | 0.91 | DGMH | 0.02 | ||||
| 4*Clust. coeff. | |||||||||
| Node | 0.61 | 0.66 | 0.64 | DGMH | 0.03 | ||||
| Edge | 0.71 | 0.89 | 0.92 | JanusNC | 0.18 | ||||
| Triangle | 0.80 | 0.95 | 0.97 | JanusNC | 0.15 | ||||
| 4-clique | 0.74 | 0.95 | 0.97 | JanusNC | 0.21 | ||||
| 4*Conn. comp. | |||||||||
| Node | 0.98 | 0.99 | 1.00 | JanusNC | 0.01 | ||||
| Edge | 0.70 | 0.84 | 0.77 | DGMH | 0.07 | ||||
| Triangle | 0.80 | 0.86 | 0.76 | DGMH | 0.04 | ||||
| 4-clique | 0.41 | 0.54 | 0.42 | DGMH | 0.01 | ||||
| 4*Conn. comp. | |||||||||
| Node | 0.54 | 0.60 | 0.73 | JanusNC | 0.06 | ||||
| Edge | 0.58 | 0.62 | 0.79 | JanusNC | 0.04 | ||||
| Triangle | 0.26 | 0.29 | 0.23 | Tie | 0.03 | ||||
| 4-clique | 0.19 | 0.20 | 0.20 | Tie | 0.01 | ||||
| 4*Diameter | |||||||||
| Node | 2.82 | 2.82 | 1.67 | JanusNC | 0.00 | ||||
| Edge | 5.71 | 5.73 | 5.48 | JanusNC | 0.02 | ||||
| Triangle | 10.40 | 10.63 | 9.51 | JanusNC | 0.23 | ||||
| 4-clique | 14.90 | 16.59 | 18.62 | JanusNC | 1.69 | ||||
| 4*Diameter | |||||||||
| Node | 4.45 | 4.50 | 4.91 | JanusNC | 0.05 | ||||
| Edge | 6.62 | 6.58 | 6.82 | JanusNC | 0.04 | ||||
| Triangle | 6.51 | 6.28 | 4.68 | JanusNC | 0.23 | ||||
| 4-clique | 2.69 | 2.70 | 2.57 | JanusNC | 0.01 | ||||
| 6r|Overall Best & JanusNC & | |||||||||
Aggregated clustering metrics by dataset.
| Dataset | ARI | NMI | AMI |
| contact-high-school | 0.97774 | 0.99512 | 0.99490 |
| contact-primary-school | 0.99224 | 0.99816 | 0.99816 |
| email-Enron | 0.99788 | 0.99914 | 0.99912 |
| email-Eu | 0.99473 | 0.99972 | 0.99972 |
| NDC-classes | 0.50184 | 0.88380 | 0.86824 |
Comparison between Janus with and without Cross-Attention (Janus*). Improvement is reported as the relative improvement of Janus over Janus*.
| Janus | Janus* | Improvement (%) | |
| Incidence Matrix Density | 0.00209 | 0.00385 | 45.64492 |
| Largest Connected Component Diameter | 0.00000 | 0.40000 | 100.00000 |
| Number of Nodes | 0.00000 | 1.40000 | 100.00000 |
| Number of Hyperedges | 0.00000 | 0.00000 | 0.00000 |
| Clique Expansion Number of Edges | 13.20000 | 50.40000 | 73.80952 |
| Line Graph Number of Edges | 20514.40000 | 35809.60000 | 42.71257 |
| Hypergraph Modularity | 0.00472 | 0.01333 | 64.63398 |
| Clique Expansion Modularity | 0.00868 | 0.00789 | -10.00372 |
| Line Graph Modularity | 0.02347 | 0.02837 | 17.30312 |
| Bipartite Graph Modularity | 0.02136 | 0.02845 | 24.93205 |
| Normalized Mutual Information | 0.09924 | 0.07788 | 27.41939 |
| Hypergraph Degree Assortativity | 0.02247 | 0.08182 | 72.53143 |
| Number of Closed Triangles | 115.20000 | 433.40000 | 73.41947 |
| Number of Open Triangles | 52.80000 | 258.00000 | 79.53488 |
| Node Degree Distribution | 3.52867 | 6.97394 | 49.40207 |
| Hyperedge Size Distribution | 0.30675 | 0.56283 | 45.49941 |
| Hyper Portrait Divergence | 0.11577 | 0.19240 | 39.82635 |
| Hyper Net Simile | 0.89838 | 1.63195 | 44.95066 |
| Average Improvement | 49.53423 |
| Model | Training Time | Sampling Time |
| Janus--VAE | 1h 34m | 7s |
| Janus-LDM | 10h 04m | - |
| Janus | 11h 38m | 42s |
| JanusNC--VAE | 1h 18m | 25s |
| JanusNC-LDM | 9h 25m | - |
| JanusNC | 10h 43m | 9m 33s |
If you use this work, please cite the manuscript:
@inproceedings{dipasquale2026janus,
title = {Hypergraph Generation with Latent Diffusion},
author = {Di Pasquale, Valerio and Antelmi, Alessia and Polato, Mirko and Spagnuolo, Carmine},
booktitle = {Advances in Neural Information Processing Systems},
year = {2026},
volume={to appear},
doi={to appear},
url={to appear}
}